By Shannon Zimmerman (TMF Zman) January 25, 2006
A quick check of the market's sale rack finds the following:
ExxonMobil (NYSE: XOM), Microsoft (Nasdaq: MSFT), Citigroup (NYSE: C), and Wal-Mart (NYSE: WMT) are all trading with trailing-12-month price-to-earnings (P/E) ratios that clock in below their respective industries' and their own five-year averages. Pfizer (NYSE: PFE), Johnson & Johnson (NYSE: JNJ), and Intel (Nasdaq: INTC) are trading at significantly discounted levels, too.
Which can only mean one thing, right? It's time to ...
Buy low! Sell high!
Just joshing. Indeed, that's one piece of investment "advice" that I suspect you've heard all too many times, and the only proper response to it is, "Well, duh." The real question, of course, is how to know if you're buying low and selling high, and one compelling way to answer that question is with discounted cash flow (DCF) analysis.
Show you the moneyRather than focusing myopically on earnings (which are easily fudged) or some kind of short-term market catalyst (which may never materialize), DCF analysis requires companies to show you the money -- literally.
By zeroing in on a firm's free cash flow (cash from operations less capital expenditures), making conservative assumptions about future earnings growth, and applying a discount rate (i.e., the return you require given a firm's business risk), you'll be in a good position to determine if a company is trading above or below its intrinsic value -- and within your margin of investing safety.
Follow the FoolThat's the tack that Philip Durell -- the Fool who leads the charge at our Motley Fool Inside Value newsletter -- takes each month as he scoops up two picks from the market's bargain bin for his subscribers. These are companies with loads of free cash flow (FCF) but whose stock is currently on sale.
One of Philip's picks, for example, is a beverage-industry behemoth that has delivered well over a billion dollars in FCF in each fiscal year since 1998 and currently trades at a P/E ratio below both its industry and that of the broader market. Another is a tech-industry titan whose current P/E is little more than half its five-year average -- despite the fact that it generated more than $4.7 billion of FCF in fiscal 2005!
Now what?The next time you think you've found a quality company at a can't-miss price, make sure it shows you the money. Using DCF analysis can help guide you to real cash and real promise -- for a real bargain.
And if you'd like to sneak a peek at Philip's full lineup of picks, just click here to take Inside Value for a risk-free spin. Your trial won't cost a thing for 30 days and will come in mighty handy, I suspect, as you go about the very important business of generating a little free cash flow of your own.
Shannon Zimmerman is the lead analyst for the Motley Fool Champion Funds newsletter service and doesn't own shares of any of the companies mentioned. Pfizer and Microsoft are Inside Value recommendations. The Fool has a strict disclosure policy.
quinta-feira, janeiro 26, 2006


segunda-feira, janeiro 16, 2006
Análise Timberland

Uma das apostas mais fortes da carteira. Vejamos porquê.
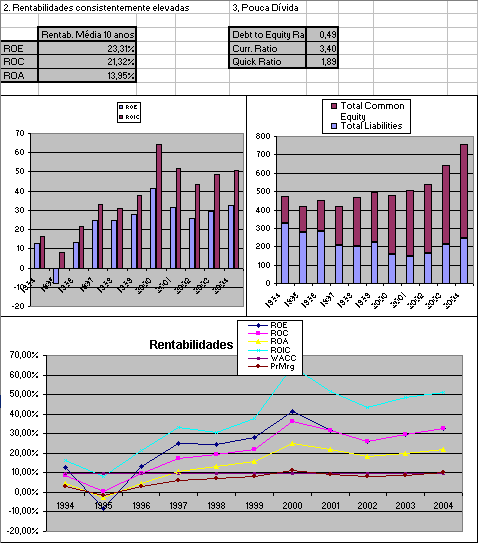
Timberland é uma marca reconhecida em termos mundiais pela qualidades dos seus produtos (calçado e roupa) e lojas que se traduzem em margens de lucro médias superiores aos seus concorrentes directos.
Rentabilidade média nos últimos 10 anos do capital próprio na ordem dos 23%, crescimento de resultados anualizados superior a 27% e rácios de solvabilidade muito conservadores (dívida praticamente inexistente).
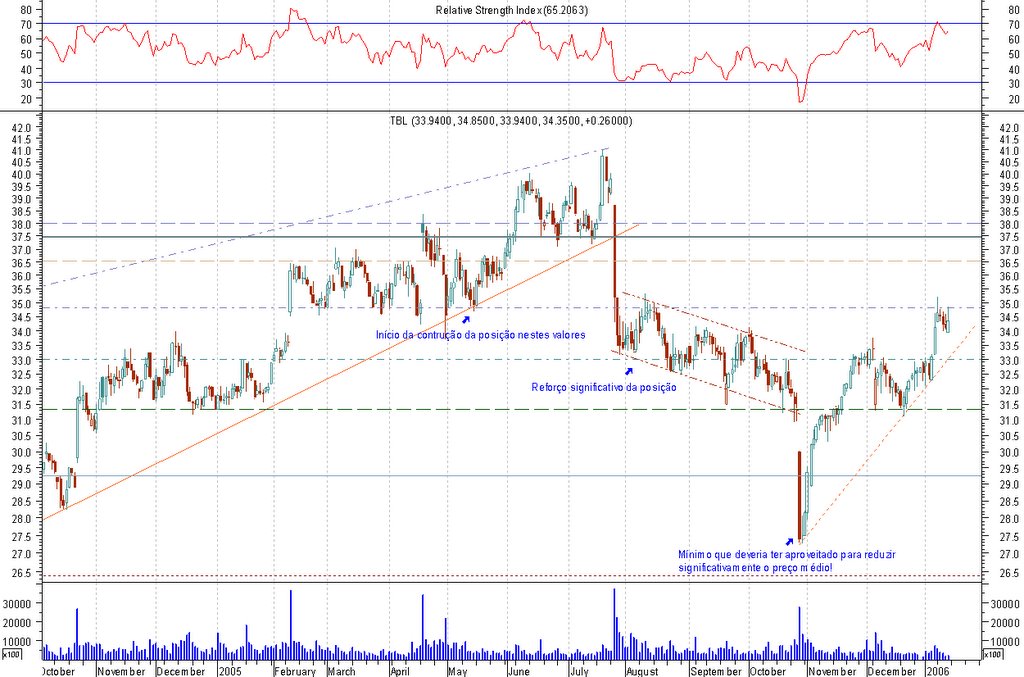
Comecei a entrar neste título em Maio do ano passado quando o título começava a entrar em máximos e com um sinal técnico bastante interessante. Teve uma apreciação assinalável que aproveitei para a realização de algumas (poucas) mais-valias. No entanto, em finais de Julho, na apresentação de resultados, os números anunciados desiludiram os investidores (com a valoriação do dólar as receitas oversees caíram) e as acções recuaram bastante. Aproveitei este recuo para reforçar de forma mais significativa a posição.
Julgo que assumi demasiado cedo uma posição muito pesada no título e aquando da divulgação de resultados no trimestre seguinte, que pela segunda vez consecutiva saíram abaixo das expectativas dos analistas, a acção voltou a recuar bastante e não pude entrar a esses preços mínimos visto já ter uma posição significativa no título.
A posição mantém e o título tem recuperado bem em direcção ao seu real valor intrínseco. A próxima apresentação de resultados está estimada para o dia 9 de Fevereiro.
Tenho por objectivo reduzir o peso deste título na carteira uma vez que acho ser demasiado para um negócio de resultados algo sazonais.
Ficam os dados fundamentais bem como o gráfico do título.



segunda-feira, dezembro 05, 2005
sexta-feira, outubro 14, 2005
Análise Lexmark
A segunda marca mundial de impressoras vem comunicando reduções sucessivas nas vendas e correspondentes lucros. A grande rival, a HP, tem vindo a pressionar bastante os preços numa estratégia de reestruturação que envolve despedimentos de pessoal, fecho de departamentos e reduções de preços e margens. No entanto, estas reduções não são sustentáveis e a estabilidade há-de regressar ao sector.
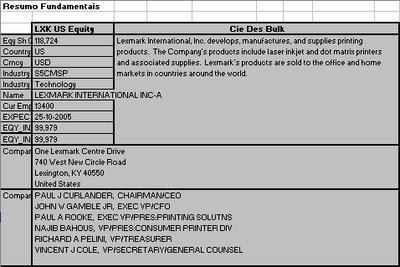
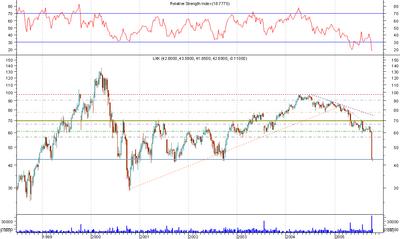
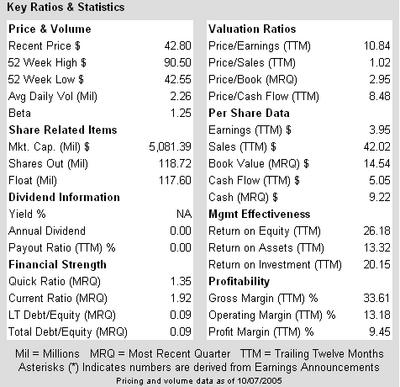
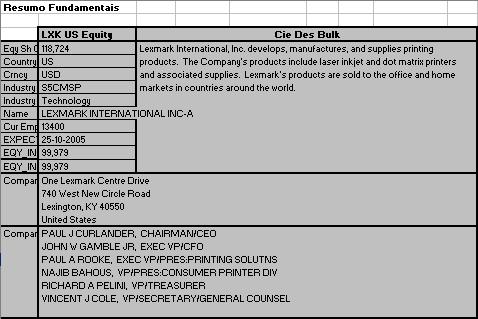
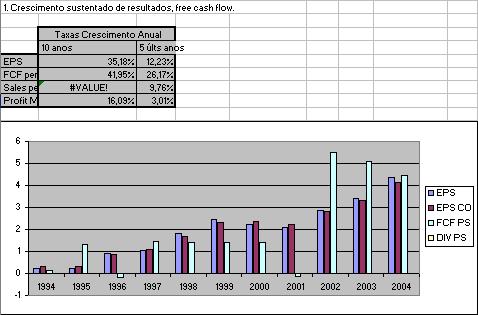
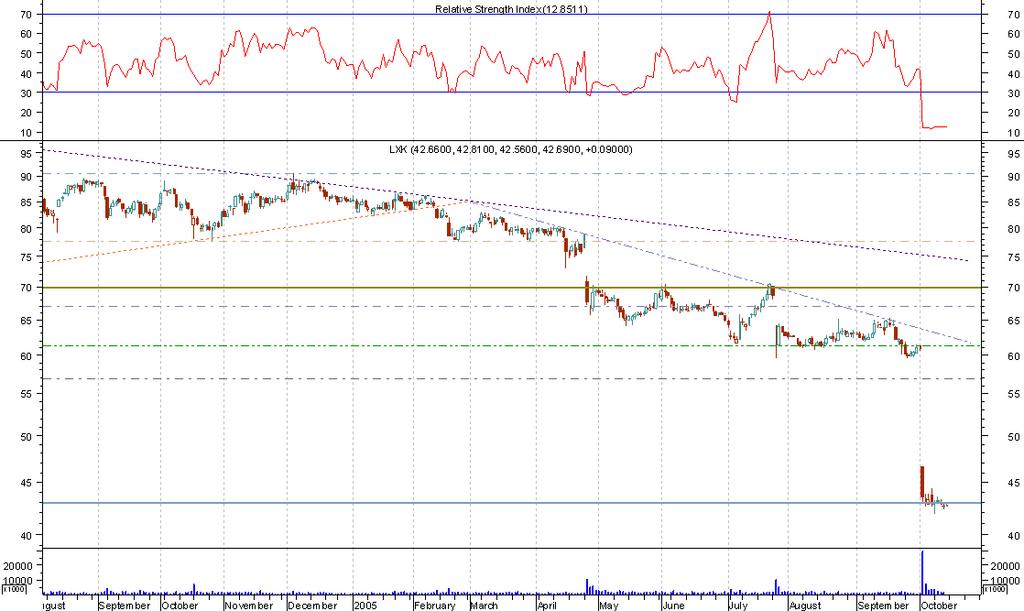
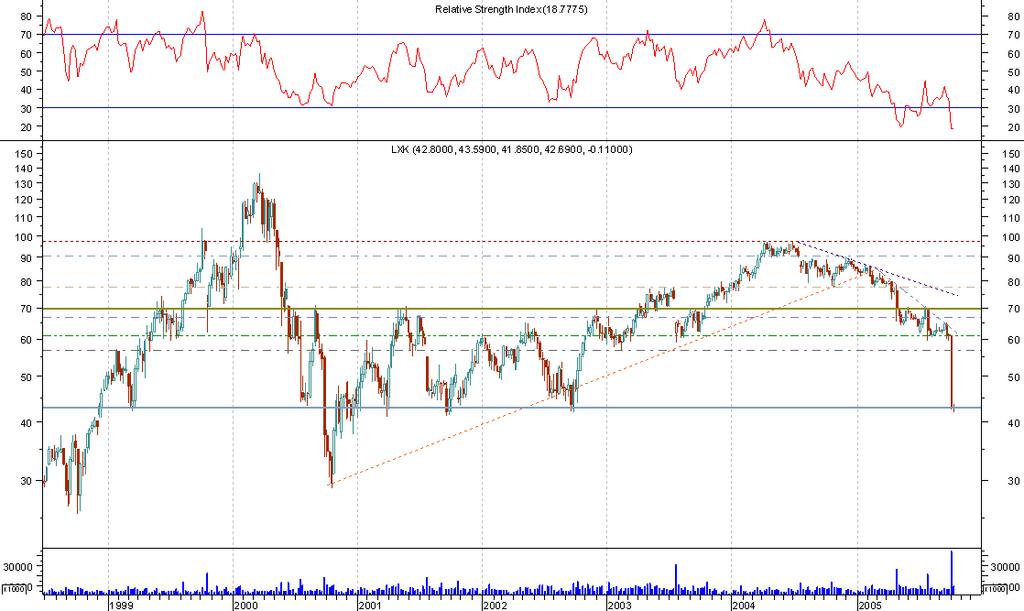
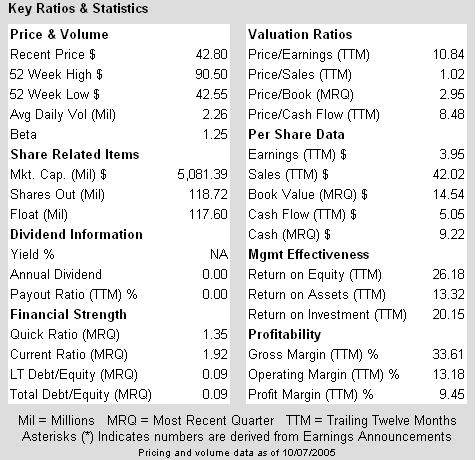
A Lexmark possui um historial de resultados muito bom como podem comprovar os dados fundamentais abaixo. Por outro lado, só este ano já caiu quase 50%! Os múltiplos encontram-se em níveis historicamente baixos.
Neste momento tenho uma posição de $3000 mas vou reforçar.
Ficam os dados fundamentais, os gráficos, uma avalição do seu valor intrínseco recorrendo ao modelo dos free cash flows descontados e os movimento efectuados até hoje.


Avaliação do Valor Íntrinseco da Lexmark assumindo um custo do capital de 9.93% e uma LT Growth Rate de 10.5% durante 10 anos.


Através deste método podemos concluir que cada acção da Lexmark vale $99.57, ou seja, 133.95% acima do preço actual!
Ficam os movimentos no título:

A Lexmark possui um historial de resultados muito bom como podem comprovar os dados fundamentais abaixo. Por outro lado, só este ano já caiu quase 50%! Os múltiplos encontram-se em níveis historicamente baixos.
Neste momento tenho uma posição de $3000 mas vou reforçar.
Ficam os dados fundamentais, os gráficos, uma avalição do seu valor intrínseco recorrendo ao modelo dos free cash flows descontados e os movimento efectuados até hoje.

Avaliação do Valor Íntrinseco da Lexmark assumindo um custo do capital de 9.93% e uma LT Growth Rate de 10.5% durante 10 anos.
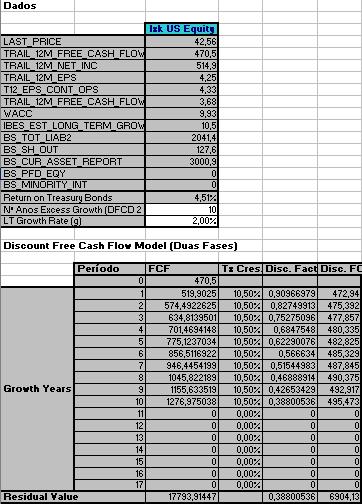

Através deste método podemos concluir que cada acção da Lexmark vale $99.57, ou seja, 133.95% acima do preço actual!
Ficam os movimentos no título:

quinta-feira, setembro 15, 2005
Análise Capital One Financial
Dando continuação à análise da semana passada, hoje vou apresentar alguns dados de outra empresa de cartões de crédito na qual entrei depois do negócio da MBNA. O sector encontra-se em concentração e esta é uma empresa apetecível de rentabilidades impressionantes. A Capital One vai comprar um banco (Hibernia) sendo este mais um movimento estratégico para potenciar o escoar dos seus cartões de crédito.
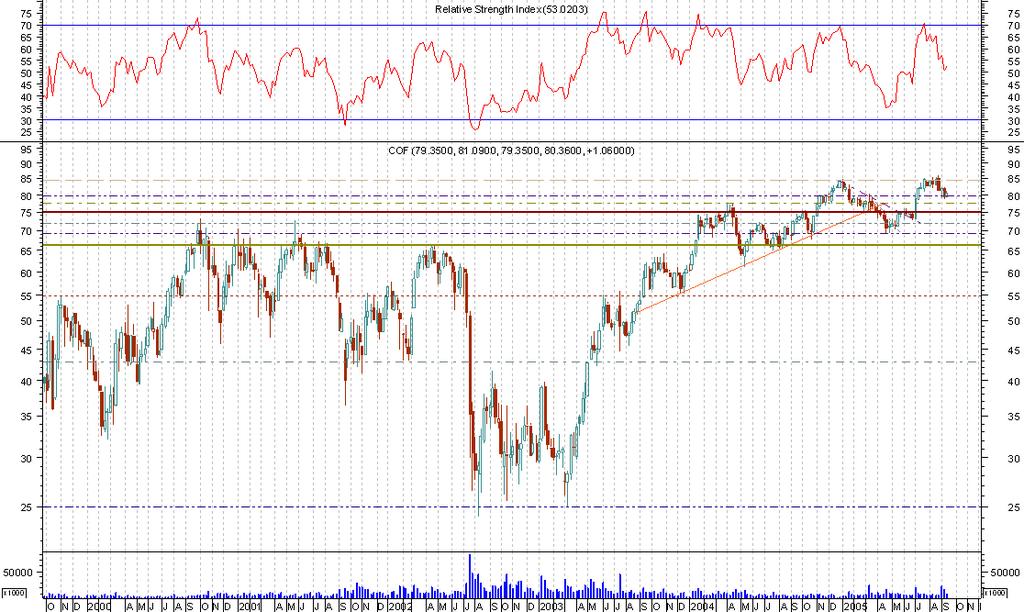
Entrei a 80.30 e só reforço no suporte dos 75. Isto porque caso recue tem um gap grande que só pára nesses valores.
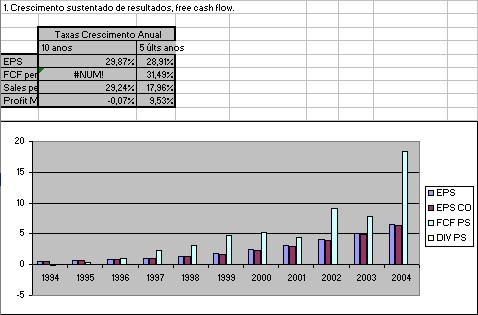
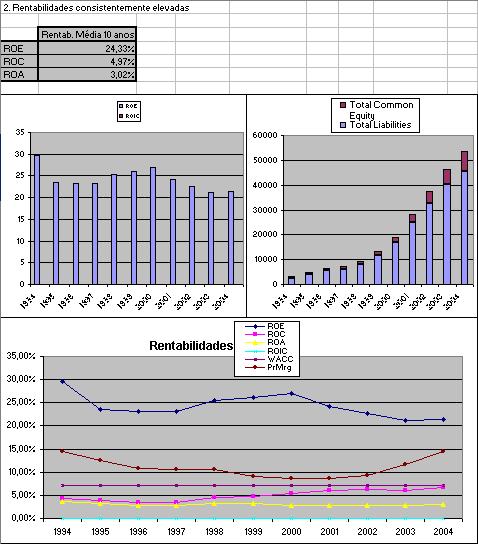
Ficam os dados fundamentais e os gráficos. Deixo, também, um modelo de avaliação extremamente simples e bastante conservador que assume crescimento perpétuo estável.


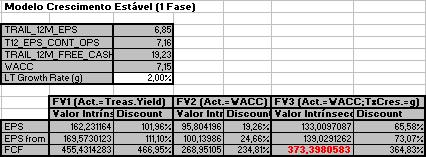
O seguinte modelo de avaliação pressupõe crescimento estável no longo prazo. São utilizadas três medidas de avaliação: Os Earnings per Share, os Earnings per Share from Continuous Operations (excluindo resultados extraordinánios) e o Free Cash Flow. Por outro lado, também são definidas três taxas de desconto dos resultados no longo prazo: Taxa Juro sem Risco (com crescimento lucros nulo), WACC - Weight Average Cost Capital (com crescimento lucros nulo) e WACC menos taxa de crescimento de longo prazo constante. Deste modo, são calculadas 9 medidas de avaliação (umas mais conservadoras que outras) fazendo simplemente a medida dos resultados a dividir pela taxa de desconto dos mesmos.
Pode-se ver que em todas as medidas de avaliação (mesmo nas mais conservadoras) a acção encontra-se a desconto. Por exempo, se tivermos em conta o EPS/WACC que pressupõe o mesmo resultado do último ano para sempre actualizados para a data de hoje à taxa WACC, aponta para um valor intrínseco de 95.80, ou seja, 19.26% acima da cotação actual.

Entrei a 80.30 e só reforço no suporte dos 75. Isto porque caso recue tem um gap grande que só pára nesses valores.
Ficam os dados fundamentais e os gráficos. Deixo, também, um modelo de avaliação extremamente simples e bastante conservador que assume crescimento perpétuo estável.
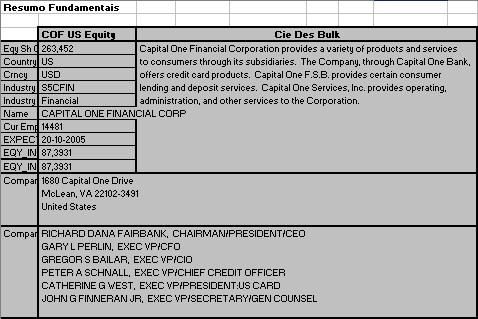

O seguinte modelo de avaliação pressupõe crescimento estável no longo prazo. São utilizadas três medidas de avaliação: Os Earnings per Share, os Earnings per Share from Continuous Operations (excluindo resultados extraordinánios) e o Free Cash Flow. Por outro lado, também são definidas três taxas de desconto dos resultados no longo prazo: Taxa Juro sem Risco (com crescimento lucros nulo), WACC - Weight Average Cost Capital (com crescimento lucros nulo) e WACC menos taxa de crescimento de longo prazo constante. Deste modo, são calculadas 9 medidas de avaliação (umas mais conservadoras que outras) fazendo simplemente a medida dos resultados a dividir pela taxa de desconto dos mesmos.
Pode-se ver que em todas as medidas de avaliação (mesmo nas mais conservadoras) a acção encontra-se a desconto. Por exempo, se tivermos em conta o EPS/WACC que pressupõe o mesmo resultado do último ano para sempre actualizados para a data de hoje à taxa WACC, aponta para um valor intrínseco de 95.80, ou seja, 19.26% acima da cotação actual.
terça-feira, setembro 13, 2005
Value Isn't Just a Number
By Stephen D. Simpson, CFA September 12, 2005
It's all too appealing to try to reduce investing to simple numbers. An undervalued ratio here, an above-average metric there, and you're good to go, right? Well, maybe not. Although numbers have their place, they must be kept in their place -- that is, as an aid to analysis and decision making, but not a driving factor. I believe that when investors look back on the history of successful companies and winning stock picks, they will see that true value is not just a sequence of numbers.
Numbers don't tell the whole truthMany different dead people are reported to have originally uttered the line "lies, damn lies, and statistics." Whoever actually said it was on to something. Numbers may be a convenient measurement tool, but what happens when management decides to tinker a bit with them? How many people bought into the Enron or WorldCom stories because they were seduced by the numbers?
Apart from these two examples of outright fraud, there are numerous companies that actively attempt to manage their earnings. A change in inventory valuation here or a readjustment of depreciation schedules there and you can smooth over quarter-by-quarter or year-by-year comparisons. Maybe this isn't a blatantly "bad" thing -- after all, investors seem to like steady growth in earnings and stock prices -- but it does point to a reason as to why you might not want to place undue reliance on the numbers.
Let's also not forget that accounting isn't necessarily meant to be used in the way that many investors try to use it. Modern accounting principles are mostly built for the purpose of tracking the movement of cash into, around, and out of a business entity. As such, it has certain limitations.
For instance, accounting treats most research and development as an expense, yet clearly companies view R&D as at least partially an investment in future products and competitiveness. If R&D is simply an expense and not a cumulative asset, why then are biotech, med-tech, and some technology companies acquired when they have no earnings and no products yet on the market?
Likewise, why aren't capital expenditures treated as an expense? Sure, you can argue that depreciation is a proxy for the need to replenish the company's capital base, but there is no requirement for a company to distinguish between "maintenance" capital expenditures and growth capital expenditures. Likewise, assets are frequently depreciated irrespective of their actual current values -- meaning that some companies may hold property that is worth little on the balance sheet (because it has been depreciated), but worth quite a bit in real life.
Simply put, modern accounting is not concerned with what really matters in evaluating a successful business -- producing an economic return on capital that is in excess of the cost of that capital. Sure, you can (and have to) use accounting inputs like pre-tax profit in your calculations, but ultimately you need to leave accounting behind to establish reasonable estimates of discounted cash flow, economic value added, or many other methods of company valuation.
Management trumps numbersIt seems as though some people forget that numbers don't run businesses -- people do. And above-average people have proved time and time again that they are capable of doing far more than what mere numbers would suggest. In other words, good management trumps numbers.
Airlines are a lousy business -- but Herb Kelleher created a winner with Southwest Airlines (NYSE: LUV). Biotechnology is the graveyard of investor dreams, but George Rathman has founded two winners -- the incredible Amgen (Nasdaq: AMGN), as well as ICOS (Nasdaq: ICOS). I couldn't count the number of failed e-businesses, but Jeff Bezos' Amazon.com (Nasdaq: AMZN) is still thriving. Could you have identified all (or any) of these winners based on solid numbers alone? I'd argue "no."
Simply put, you can't quantify the above-average opportunities that are created by talented and visionary managers. Unfortunately there is no price-to-creativity ratio, nor a way to measure return on management vision. Sustainable competitive advantages and economic moats are hard to quantify much beyond "I know 'em when I see 'em," and yet they are critical components to long-term stock market success.
In the absence of a Michael Dell ratio, remember that numbers are either reflective (looking back on reported results) or prospective (projecting future results), but they themselves don't produce anything. One person may build a model showing Overstock.com (Nasdaq: OSTK) to be overvalued by 50%, another person can produce a model showing the stock to be undervalued by 50%. In either case, the numbers themselves don't make it so; management and competition ultimately write the story.
Cheap can be cheap for a reasonPerhaps it's because I identify myself with the value crowd, but I happen to think that value investing is the most misunderstood investment philosophy. Look at a lot of popular investment books and you get the sense that value investing is all about numbers -- P/Es, price-to-book ratios, and so on. This not only gives short shrift to what real value investing is all about, but it can be dangerous for the novice or lazy investor.
Too often investors look only at a P/E ratio or maybe an enterprise value-to-free cash flow (EV/FCF) ratio and declare a company "cheap" or a "value stock." Unfortunately, these cheap numbers are easily misunderstood. Cheap is not cheap if the company is at a cyclical peak and earnings are about to go into decline. Cheap is not cheap if the company or industry are no longer competitive and are instead doomed to eventual decline (consider Berkshire Hathaway's namesake investment in the textile industry).
Likewise, a company about to begin a cyclical upswing will not look cheap. A company that has staunched the bleeding and begun a turnaround will not look cheap. A company with a proven competitive advantage and a solid growth outlook will not look cheap. And yet, all three of these archtypes can certainly be core value investment ideas.
What "real value" isSo if value isn't to be found hidden in a ratio or buried in a formula, where do you find it? Ideally, real value is a long-term competitive advantage purchased at a good price that includes a margin of error. I say "ideally" because cyclical companies and turnaround candidates can also be true value stocks if purchased correctly -- the long-term sustainable competitive advantage may be lacking, but a large enough discount to intrinsic value can make up the difference.
Identifying quality turnaround and cyclical opportunities is a subject for another day, so I'll instead focus on some thoughts about core value companies. These are companies with strong economic moats -- sustainable competitive advantages that help to insulate the company from competitors and allow for above-average earnings growth. These are also companies that produce real economic value -- meaning that they can take a pool of capital and reliably achieve financial returns well in excess of the cost of that capital. That might seem simple and obvious, but not many companies manage to do it for the long term.
Last, but not least, real value is a company that has a great management team with access to reasonably priced capital and free economic opportunities to expand. Don't overlook this latter point, as few companies can match Motley Fool Inside Value pick Coca-Cola (NYSE: KO) and do basically the same thing for decades on end. Microsoft (Nasdaq: MSFT) has expanded far beyond computer operating systems, IBM has long since grown beyond adding machines, and AIG is not "just" an insurance company.
We look for real valueDon't worry -- you're not out on your own looking for true value opportunities. We have an entire team at The Motley Fool that does little else but look for high-quality companies trading at very attractive prices. This Inside Value team has already done quite well for its subscribers, and I believe that any investors who want to appreciate true value investing should at least take a 30-day trial subscription to the newsletter service.
Bottom lineRemember, value isn't a number. There is no ratio or combination of formulas that can reliably guide you to true value opportunities. Successful investing is not mechanical -- it's subjective and qualitative. Numbers are a crucial part of the process and can reveal important information, but they must be kept in context. Like light reflecting off a mirror, investors should remember that numbers can reflect the state of a company -- but they aren't themselves the company. By looking beyond the numbers and appreciating them in context, investors can unearth the true values in the stock market and beat the conventional averages.
in MotleyFool.com
It's all too appealing to try to reduce investing to simple numbers. An undervalued ratio here, an above-average metric there, and you're good to go, right? Well, maybe not. Although numbers have their place, they must be kept in their place -- that is, as an aid to analysis and decision making, but not a driving factor. I believe that when investors look back on the history of successful companies and winning stock picks, they will see that true value is not just a sequence of numbers.
Numbers don't tell the whole truthMany different dead people are reported to have originally uttered the line "lies, damn lies, and statistics." Whoever actually said it was on to something. Numbers may be a convenient measurement tool, but what happens when management decides to tinker a bit with them? How many people bought into the Enron or WorldCom stories because they were seduced by the numbers?
Apart from these two examples of outright fraud, there are numerous companies that actively attempt to manage their earnings. A change in inventory valuation here or a readjustment of depreciation schedules there and you can smooth over quarter-by-quarter or year-by-year comparisons. Maybe this isn't a blatantly "bad" thing -- after all, investors seem to like steady growth in earnings and stock prices -- but it does point to a reason as to why you might not want to place undue reliance on the numbers.
Let's also not forget that accounting isn't necessarily meant to be used in the way that many investors try to use it. Modern accounting principles are mostly built for the purpose of tracking the movement of cash into, around, and out of a business entity. As such, it has certain limitations.
For instance, accounting treats most research and development as an expense, yet clearly companies view R&D as at least partially an investment in future products and competitiveness. If R&D is simply an expense and not a cumulative asset, why then are biotech, med-tech, and some technology companies acquired when they have no earnings and no products yet on the market?
Likewise, why aren't capital expenditures treated as an expense? Sure, you can argue that depreciation is a proxy for the need to replenish the company's capital base, but there is no requirement for a company to distinguish between "maintenance" capital expenditures and growth capital expenditures. Likewise, assets are frequently depreciated irrespective of their actual current values -- meaning that some companies may hold property that is worth little on the balance sheet (because it has been depreciated), but worth quite a bit in real life.
Simply put, modern accounting is not concerned with what really matters in evaluating a successful business -- producing an economic return on capital that is in excess of the cost of that capital. Sure, you can (and have to) use accounting inputs like pre-tax profit in your calculations, but ultimately you need to leave accounting behind to establish reasonable estimates of discounted cash flow, economic value added, or many other methods of company valuation.
Management trumps numbersIt seems as though some people forget that numbers don't run businesses -- people do. And above-average people have proved time and time again that they are capable of doing far more than what mere numbers would suggest. In other words, good management trumps numbers.
Airlines are a lousy business -- but Herb Kelleher created a winner with Southwest Airlines (NYSE: LUV). Biotechnology is the graveyard of investor dreams, but George Rathman has founded two winners -- the incredible Amgen (Nasdaq: AMGN), as well as ICOS (Nasdaq: ICOS). I couldn't count the number of failed e-businesses, but Jeff Bezos' Amazon.com (Nasdaq: AMZN) is still thriving. Could you have identified all (or any) of these winners based on solid numbers alone? I'd argue "no."
Simply put, you can't quantify the above-average opportunities that are created by talented and visionary managers. Unfortunately there is no price-to-creativity ratio, nor a way to measure return on management vision. Sustainable competitive advantages and economic moats are hard to quantify much beyond "I know 'em when I see 'em," and yet they are critical components to long-term stock market success.
In the absence of a Michael Dell ratio, remember that numbers are either reflective (looking back on reported results) or prospective (projecting future results), but they themselves don't produce anything. One person may build a model showing Overstock.com (Nasdaq: OSTK) to be overvalued by 50%, another person can produce a model showing the stock to be undervalued by 50%. In either case, the numbers themselves don't make it so; management and competition ultimately write the story.
Cheap can be cheap for a reasonPerhaps it's because I identify myself with the value crowd, but I happen to think that value investing is the most misunderstood investment philosophy. Look at a lot of popular investment books and you get the sense that value investing is all about numbers -- P/Es, price-to-book ratios, and so on. This not only gives short shrift to what real value investing is all about, but it can be dangerous for the novice or lazy investor.
Too often investors look only at a P/E ratio or maybe an enterprise value-to-free cash flow (EV/FCF) ratio and declare a company "cheap" or a "value stock." Unfortunately, these cheap numbers are easily misunderstood. Cheap is not cheap if the company is at a cyclical peak and earnings are about to go into decline. Cheap is not cheap if the company or industry are no longer competitive and are instead doomed to eventual decline (consider Berkshire Hathaway's namesake investment in the textile industry).
Likewise, a company about to begin a cyclical upswing will not look cheap. A company that has staunched the bleeding and begun a turnaround will not look cheap. A company with a proven competitive advantage and a solid growth outlook will not look cheap. And yet, all three of these archtypes can certainly be core value investment ideas.
What "real value" isSo if value isn't to be found hidden in a ratio or buried in a formula, where do you find it? Ideally, real value is a long-term competitive advantage purchased at a good price that includes a margin of error. I say "ideally" because cyclical companies and turnaround candidates can also be true value stocks if purchased correctly -- the long-term sustainable competitive advantage may be lacking, but a large enough discount to intrinsic value can make up the difference.
Identifying quality turnaround and cyclical opportunities is a subject for another day, so I'll instead focus on some thoughts about core value companies. These are companies with strong economic moats -- sustainable competitive advantages that help to insulate the company from competitors and allow for above-average earnings growth. These are also companies that produce real economic value -- meaning that they can take a pool of capital and reliably achieve financial returns well in excess of the cost of that capital. That might seem simple and obvious, but not many companies manage to do it for the long term.
Last, but not least, real value is a company that has a great management team with access to reasonably priced capital and free economic opportunities to expand. Don't overlook this latter point, as few companies can match Motley Fool Inside Value pick Coca-Cola (NYSE: KO) and do basically the same thing for decades on end. Microsoft (Nasdaq: MSFT) has expanded far beyond computer operating systems, IBM has long since grown beyond adding machines, and AIG is not "just" an insurance company.
We look for real valueDon't worry -- you're not out on your own looking for true value opportunities. We have an entire team at The Motley Fool that does little else but look for high-quality companies trading at very attractive prices. This Inside Value team has already done quite well for its subscribers, and I believe that any investors who want to appreciate true value investing should at least take a 30-day trial subscription to the newsletter service.
Bottom lineRemember, value isn't a number. There is no ratio or combination of formulas that can reliably guide you to true value opportunities. Successful investing is not mechanical -- it's subjective and qualitative. Numbers are a crucial part of the process and can reveal important information, but they must be kept in context. Like light reflecting off a mirror, investors should remember that numbers can reflect the state of a company -- but they aren't themselves the company. By looking beyond the numbers and appreciating them in context, investors can unearth the true values in the stock market and beat the conventional averages.
in MotleyFool.com
quinta-feira, setembro 08, 2005
Análise MBNA
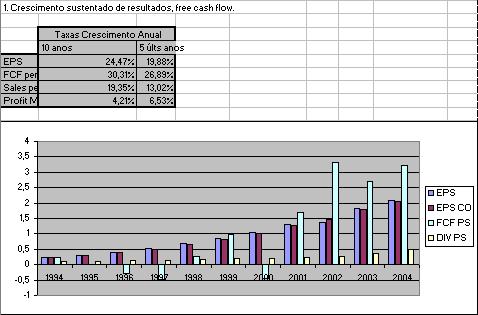
Hoje vou apresentar a análise a uma empresa que já fez parte da carteira mas cuja posição fechei entretanto: a MBNA (Ticker: KRB). Trata-se de uma empresa de cartões de crédito com rentabilidades impressionantes e crescimento de resultados incrivelmente consistentes.
Este caso é, ao mesmo tempo, um excelente exemplo do que procuro demonstar com este método de investimento mas, também, uma situação que pode iludir os investidores mais ansiosos.
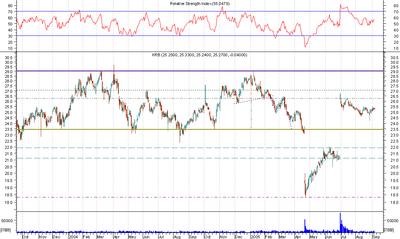
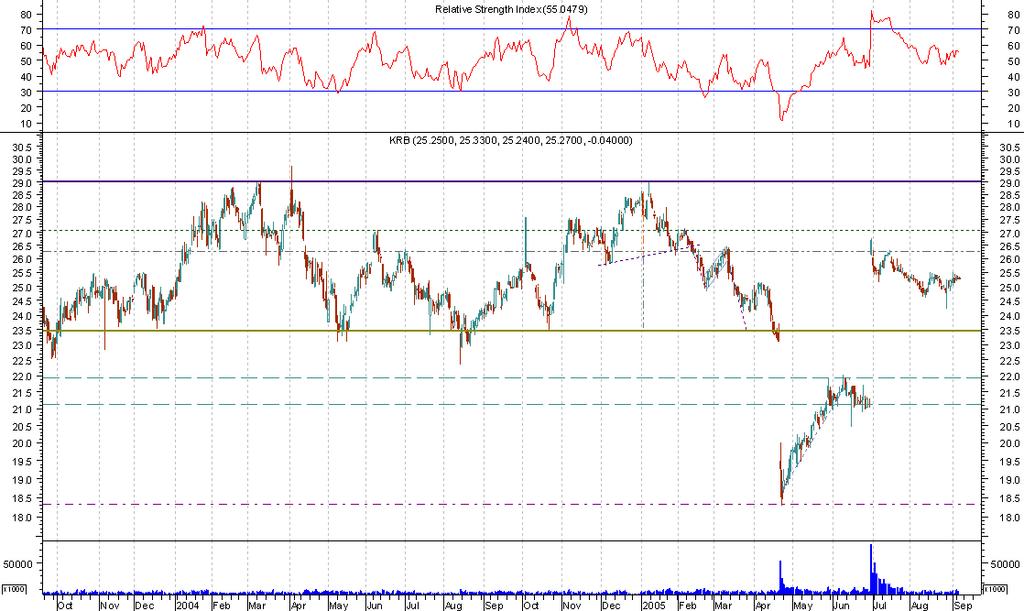
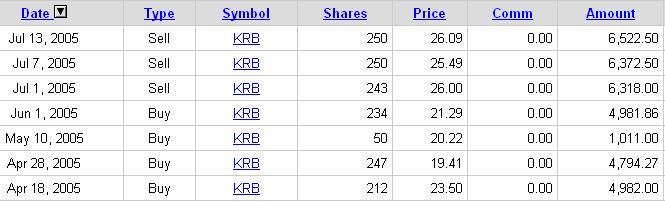
O gráfico da cotação vinha variando entre 23.5 e os 29 e face ao PER que estava na altura (cerca de 11) esperei que viesse retestar o suporte para entrar. Assim aconteceu, quando entrei no dia 18/04, precisamente nos 23.5 com $5000. Exactamente passados 3 dias, na divulgação de resultados da empresa, ela anuncia que as perspectivas de crescimento de resultados para os próximos trimestres serão abaixo do previsto, uma vez que muito do crédito concedido estava a ser, extraordinariamente, liquidado. As acções caíram mais de 18%.
Nesta altura com uma posição a perder tanto o que deve fazer o investidor fundamental?
R: Com calma, analisar os dados divulgados e ver se, através deles, se podia induzir alguma alteração estrutural do negócio que pudesse justificar a correcção ocorrida. Não era o caso. Evidentemente, que a empresa sofreria algumas contrariedades de curto-prazo mas o contexto de crescimento de longo prazo mantinha-se/mantém-se intacto.
Resultado: A empresa estava a um PER ainda mais atractivo (cerca de 9.5) e portanto decidi reforçar. Reforcei a 19.41, a 20.22 e a 21.29 construindo uma posição de aproximadamente $16.000. Por essa altura começam a surgir rumores de que a empresa poderia a vir ser adquirida por um dos maiores banco dos USA.
A 30/06 o Bank of America anunciou o acordo para aquisição da MBNA com um prémio superior a 30%. Os seus administradores demonstraram o seu entusiasmo por uma aquisição de $35 biliões de dólares numa empresa com uma larga base de clientes, com enorme potencial de crescimento e uma excelente administração.
É claro que assim dá gosto analisar fundamentais. Mas é aqui que eu chamo a atenção do potencial investidor fundamental. Não nos podemos deixar iludir pois esta foi uma situação extraordinária. Caso a OPA não tivesse ocorrido teria de esperar muito mais tempo antes de a ver atingir aqueles preços. É preciso calma, acreditar nos fundamentais e esperar.
Com a venda da posição deste título abri uma nova numa concorrente da MBNA: a Capital One Financial. Também se fala que poderá vir a ser comprada, mas isso pouco interessa. Não abro posições com base em rumores. Tenho é confiança nos fundamentais.
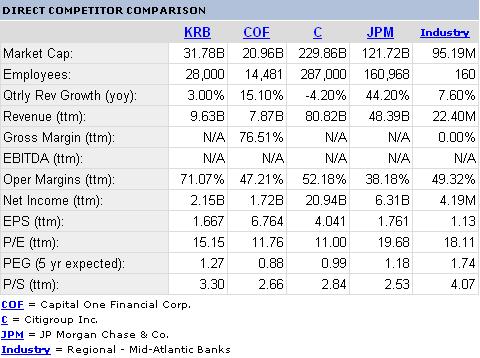
Ficam os dados da MBNA, o gráfico e os movimentos no título. No final, deixo também um quadro com alguns dados comparativos de empresas do sector onde se pode ver, actualmente, a boa posição da Capital One Financial.




Este caso é, ao mesmo tempo, um excelente exemplo do que procuro demonstar com este método de investimento mas, também, uma situação que pode iludir os investidores mais ansiosos.
O gráfico da cotação vinha variando entre 23.5 e os 29 e face ao PER que estava na altura (cerca de 11) esperei que viesse retestar o suporte para entrar. Assim aconteceu, quando entrei no dia 18/04, precisamente nos 23.5 com $5000. Exactamente passados 3 dias, na divulgação de resultados da empresa, ela anuncia que as perspectivas de crescimento de resultados para os próximos trimestres serão abaixo do previsto, uma vez que muito do crédito concedido estava a ser, extraordinariamente, liquidado. As acções caíram mais de 18%.
Nesta altura com uma posição a perder tanto o que deve fazer o investidor fundamental?
R: Com calma, analisar os dados divulgados e ver se, através deles, se podia induzir alguma alteração estrutural do negócio que pudesse justificar a correcção ocorrida. Não era o caso. Evidentemente, que a empresa sofreria algumas contrariedades de curto-prazo mas o contexto de crescimento de longo prazo mantinha-se/mantém-se intacto.
Resultado: A empresa estava a um PER ainda mais atractivo (cerca de 9.5) e portanto decidi reforçar. Reforcei a 19.41, a 20.22 e a 21.29 construindo uma posição de aproximadamente $16.000. Por essa altura começam a surgir rumores de que a empresa poderia a vir ser adquirida por um dos maiores banco dos USA.
A 30/06 o Bank of America anunciou o acordo para aquisição da MBNA com um prémio superior a 30%. Os seus administradores demonstraram o seu entusiasmo por uma aquisição de $35 biliões de dólares numa empresa com uma larga base de clientes, com enorme potencial de crescimento e uma excelente administração.
É claro que assim dá gosto analisar fundamentais. Mas é aqui que eu chamo a atenção do potencial investidor fundamental. Não nos podemos deixar iludir pois esta foi uma situação extraordinária. Caso a OPA não tivesse ocorrido teria de esperar muito mais tempo antes de a ver atingir aqueles preços. É preciso calma, acreditar nos fundamentais e esperar.
Com a venda da posição deste título abri uma nova numa concorrente da MBNA: a Capital One Financial. Também se fala que poderá vir a ser comprada, mas isso pouco interessa. Não abro posições com base em rumores. Tenho é confiança nos fundamentais.
Ficam os dados da MBNA, o gráfico e os movimentos no título. No final, deixo também um quadro com alguns dados comparativos de empresas do sector onde se pode ver, actualmente, a boa posição da Capital One Financial.


Subscrever:
Mensagens (Atom)