Funds that might tempt the Oracle of Omaha
http://www.marketwatch.com/News/Story/Story.aspx?guid=%7BCD9CC4E8%2DB878%2D42A0%2D8527%2D8912C98D5F72%7D&siteid=mktw&dist=
segunda-feira, março 27, 2006


sexta-feira, março 24, 2006
Investment Rules of Warren Buffet
WARREN BUFFETT
Buffett is known as the worlds greatest ever investor and here are some of the rules that he follows:
Commonsense Investment Rules
1. Have a written or mental note of your investment plan and have the discipline to follow it.
Be flexible enough to change or evolve your investment strategies when sound judgement and conditions so warrant.
2. Study sales and earnings of a company and how they are derived.
3. Focus on your purchase candidate. Understand the firm’s products or services, the company’s position in its industry, and how it compares with the competition.
4. Learn as much as possible about the people managing the business.
5. When you find a great stock value, don’t be swayed by predictions for the stock market or the economy.
6. Sit on the sidelines in a cash position if you can’t find investments of value based on your criteria. Many emotional investors make the mistake of buying at very high prices relative to value.
7. Define what you don’t know as well as what you do know and stick to what you know.
Evaluation Rules
1. Is the business understandable?
2. Are the CEO and top executives focused and capable based on the firm’s previous track record of sales and earnings and how the business is run?
3. Does management report candidly to shareholders?
4. Does the company have top quality, brand name products used repeatedly and high customer loyalty?
5. Does the company have a wide competitive edge and barriers to potential competition?
6. Is the business generating good owner earnings; free cash flows?
7. Does the business have a long-term history of increasing sales and earnings at a favourable rate of growth?
8. Has the company achieved a 15 percent or better return on shareholders equity and a return that compares favourably with alternative investments?
9. Has the company maintained a favourable profit margin compared with the competitors profit margin?
10. What are the goals of the business and the plans to achieve them?
11. What are the risks of the business?
12. Does the business have good financial strength with low or manageable debt requirements?
13. Is the stock selling at a reasonable price relative to future earnings and price potential?
GLOSSARY
Net Profit Margin = Net Income
Sales
Operating Profit Margin= Operating Earnings before Interest, Depreciation and Taxes
Sales
Book Value Per Share= Assets- Liabilities
Number of Shares Outstanding
Return on Shareholders’ equity = Net Income
Common stock equity
Debt to capital ratio = Long-Term Debt
Long-Term debt + Shareholders Equity
Buffett is known as the worlds greatest ever investor and here are some of the rules that he follows:
Commonsense Investment Rules
1. Have a written or mental note of your investment plan and have the discipline to follow it.
Be flexible enough to change or evolve your investment strategies when sound judgement and conditions so warrant.
2. Study sales and earnings of a company and how they are derived.
3. Focus on your purchase candidate. Understand the firm’s products or services, the company’s position in its industry, and how it compares with the competition.
4. Learn as much as possible about the people managing the business.
5. When you find a great stock value, don’t be swayed by predictions for the stock market or the economy.
6. Sit on the sidelines in a cash position if you can’t find investments of value based on your criteria. Many emotional investors make the mistake of buying at very high prices relative to value.
7. Define what you don’t know as well as what you do know and stick to what you know.
Evaluation Rules
1. Is the business understandable?
2. Are the CEO and top executives focused and capable based on the firm’s previous track record of sales and earnings and how the business is run?
3. Does management report candidly to shareholders?
4. Does the company have top quality, brand name products used repeatedly and high customer loyalty?
5. Does the company have a wide competitive edge and barriers to potential competition?
6. Is the business generating good owner earnings; free cash flows?
7. Does the business have a long-term history of increasing sales and earnings at a favourable rate of growth?
8. Has the company achieved a 15 percent or better return on shareholders equity and a return that compares favourably with alternative investments?
9. Has the company maintained a favourable profit margin compared with the competitors profit margin?
10. What are the goals of the business and the plans to achieve them?
11. What are the risks of the business?
12. Does the business have good financial strength with low or manageable debt requirements?
13. Is the stock selling at a reasonable price relative to future earnings and price potential?
GLOSSARY
Net Profit Margin = Net Income
Sales
Operating Profit Margin= Operating Earnings before Interest, Depreciation and Taxes
Sales
Book Value Per Share= Assets- Liabilities
Number of Shares Outstanding
Return on Shareholders’ equity = Net Income
Common stock equity
Debt to capital ratio = Long-Term Debt
Long-Term debt + Shareholders Equity
quinta-feira, março 16, 2006
Picking Stocks: Value and Growth Metrics
by Alan Hartley 03-15-06 06:00 AM
Most great investors don't concern themselves with value versus growth, but instead focus on finding good stocks at good prices. After all, even a wonderful business isn't a good investment if the price is too high. To quote Warren Buffett on the matter, "growth and value investing are joined at the hip." If one of the greatest investors of all time doesn't pigeonhole himself, why should you? The quest for good "value" can often lead to a growth stock that many value devotees have overlooked, so use all the tools at your disposal.
At Morningstar, we pride ourselves on using our discounted cash-flow model to estimate a company's intrinsic worth. At its most simplistic, we forecast a company's financial statements for at least the next five years and discount the future cash flows back at the company's cost of capital. If the stock is trading significantly below our fair value estimate, what we call the margin of safety, we consider investing. This long-term approach captures both value and growth and gives Morningstar a powerful advantage of time horizon arbitrage over our competitors and other techniques that focus only on the next several quarters.
That said, multiple analysis, which captures only one year of data, is still valuable if used properly. The most popular and perhaps the most useful is the trailing price/earnings, or P/E, ratio (the price of the stock divided by the most recent 12 months' earnings per share). When a company that has averaged a 31 P/E over the last five years but today trades at a P/E of only 18 (think Wal-Mart WMT), it may represent a good buying opportunity. But historical earnings are not always representative of the future, of course. The next year could present an entirely different situation and may explain the drop in P/E.
A ratio widely used by growth enthusiasts is the PEG ratio (a company's P/E ratio divided by its estimated future earnings per share growth rate). A benefit that the PEG ratio has over P/Es is that it accounts for both the past and the future. But because the PEG ratio uses the company's P/E ratio, it has the same limitation with a caveat: The five-year EPS growth rate used in the calculation is only an estimate, and results could be materially different than expected. A simple rule of thumb is if a company trades for one-and-a-half times its growth rate (a PEG ratio of 1.5) or less, it may be worth a look.
Investors often swear by a particular method, but why not combine them and look for stocks that are cheap by each measure? Here are five 5-star stocks that pass each test and have compelling fundamentals:
3M MMM
Analyst: Scott BurnsFair
Value Estimate: $89
Consider Buying Price: $75.80
From the Analyst Report: 3M's history of innovation often overshadows the company's ability to generate strong profits on mundane products. Although many of 3M's products are high-margin branded or patented products, the company has made things such as sandpaper, adhesives, Post-it notes, and Scotch tape for decades. 3M fiercely protects its patents and uses its protected period to perfect its production processes. Combining this production expertise with the company's global manufacturing base makes it cost prohibitive for rivals to undercut its prices once items fall off patent. As a result of its patents, brands, and low-cost production, 3M has averaged 18% operating margins over the past five years.
Apollo Group A APOL
Analyst: Kristan Rowland
Fair Value Estimate: $70
Consider Buying Price: $54.00
From the Analyst Report: Apollo's regional accreditation, recognizable brands, and solid reputation contribute to its wide moat. Its University of Phoenix and Western International University are regionally accredited. Accreditation is difficult to obtain and allows UOP and WIU to participate in federal student aid programs (63% and 72% of students at each institution, respectively).
Applebee's International APPB
Analyst: John Owens, CFA, CPA
Fair Value Estimate: $33
Consider Buying Price: $25.40
From the Analyst Report: With a potential universe of 3,000 domestic restaurants, Applebee's still has substantial opportunity for growth, in our opinion. The management team has proved very adept at development, opening at least 100 new restaurants for 13 consecutive years. The company has been particularly successful in seizing a first-mover advantage in small-town locations with a unit design that generates healthy returns. Over the past five reported years, the firm delivered a 23% average return on invested capital, well above our estimate of its cost of capital.
Johnson & Johnson JNJ
Analyst: Tom D'Amore, CFA
Fair Value Estimate: $76
Consider Buying Price: $64.80
From the Analyst Report: J&J is a model of consistency and stability. The firm has delivered 19 consecutive years of double-digit earnings increases and 42 consecutive years of dividend increases. Cash flow from operations covers the dividend nearly 3 times. J&J has an excellent record of capital allocation and generation. Returns on invested capital averaged 22% during the past five years.
Maxim Integrated Products Inc. MXIM
Analyst: Larry Cao, CFA
Fair Value Estimate: $52
Consider Buying Price: $40.10
From the Analyst Report: Maxim's focus on profitable growth has achieved remarkable financial success. With high margins and stable returns on invested capital, Maxim's financials can easily be mistaken for those of a top-tier software company. In its fiscal 2005, Maxim achieved gross margin of 72%, operating margin of 47% (both before deducting stock option expenses), and return on assets close to 20%. Not only does its profitability outshine chip industry peers, it also rivals that of software giants Microsoft and Oracle.
in http://news.morningstar.com/article/article.asp?id=157493&pgid=wwhome1a
Most great investors don't concern themselves with value versus growth, but instead focus on finding good stocks at good prices. After all, even a wonderful business isn't a good investment if the price is too high. To quote Warren Buffett on the matter, "growth and value investing are joined at the hip." If one of the greatest investors of all time doesn't pigeonhole himself, why should you? The quest for good "value" can often lead to a growth stock that many value devotees have overlooked, so use all the tools at your disposal.
At Morningstar, we pride ourselves on using our discounted cash-flow model to estimate a company's intrinsic worth. At its most simplistic, we forecast a company's financial statements for at least the next five years and discount the future cash flows back at the company's cost of capital. If the stock is trading significantly below our fair value estimate, what we call the margin of safety, we consider investing. This long-term approach captures both value and growth and gives Morningstar a powerful advantage of time horizon arbitrage over our competitors and other techniques that focus only on the next several quarters.
That said, multiple analysis, which captures only one year of data, is still valuable if used properly. The most popular and perhaps the most useful is the trailing price/earnings, or P/E, ratio (the price of the stock divided by the most recent 12 months' earnings per share). When a company that has averaged a 31 P/E over the last five years but today trades at a P/E of only 18 (think Wal-Mart WMT), it may represent a good buying opportunity. But historical earnings are not always representative of the future, of course. The next year could present an entirely different situation and may explain the drop in P/E.
A ratio widely used by growth enthusiasts is the PEG ratio (a company's P/E ratio divided by its estimated future earnings per share growth rate). A benefit that the PEG ratio has over P/Es is that it accounts for both the past and the future. But because the PEG ratio uses the company's P/E ratio, it has the same limitation with a caveat: The five-year EPS growth rate used in the calculation is only an estimate, and results could be materially different than expected. A simple rule of thumb is if a company trades for one-and-a-half times its growth rate (a PEG ratio of 1.5) or less, it may be worth a look.
Investors often swear by a particular method, but why not combine them and look for stocks that are cheap by each measure? Here are five 5-star stocks that pass each test and have compelling fundamentals:
3M MMM
Analyst: Scott BurnsFair
Value Estimate: $89
Consider Buying Price: $75.80
From the Analyst Report: 3M's history of innovation often overshadows the company's ability to generate strong profits on mundane products. Although many of 3M's products are high-margin branded or patented products, the company has made things such as sandpaper, adhesives, Post-it notes, and Scotch tape for decades. 3M fiercely protects its patents and uses its protected period to perfect its production processes. Combining this production expertise with the company's global manufacturing base makes it cost prohibitive for rivals to undercut its prices once items fall off patent. As a result of its patents, brands, and low-cost production, 3M has averaged 18% operating margins over the past five years.
Apollo Group A APOL
Analyst: Kristan Rowland
Fair Value Estimate: $70
Consider Buying Price: $54.00
From the Analyst Report: Apollo's regional accreditation, recognizable brands, and solid reputation contribute to its wide moat. Its University of Phoenix and Western International University are regionally accredited. Accreditation is difficult to obtain and allows UOP and WIU to participate in federal student aid programs (63% and 72% of students at each institution, respectively).
Applebee's International APPB
Analyst: John Owens, CFA, CPA
Fair Value Estimate: $33
Consider Buying Price: $25.40
From the Analyst Report: With a potential universe of 3,000 domestic restaurants, Applebee's still has substantial opportunity for growth, in our opinion. The management team has proved very adept at development, opening at least 100 new restaurants for 13 consecutive years. The company has been particularly successful in seizing a first-mover advantage in small-town locations with a unit design that generates healthy returns. Over the past five reported years, the firm delivered a 23% average return on invested capital, well above our estimate of its cost of capital.
Johnson & Johnson JNJ
Analyst: Tom D'Amore, CFA
Fair Value Estimate: $76
Consider Buying Price: $64.80
From the Analyst Report: J&J is a model of consistency and stability. The firm has delivered 19 consecutive years of double-digit earnings increases and 42 consecutive years of dividend increases. Cash flow from operations covers the dividend nearly 3 times. J&J has an excellent record of capital allocation and generation. Returns on invested capital averaged 22% during the past five years.
Maxim Integrated Products Inc. MXIM
Analyst: Larry Cao, CFA
Fair Value Estimate: $52
Consider Buying Price: $40.10
From the Analyst Report: Maxim's focus on profitable growth has achieved remarkable financial success. With high margins and stable returns on invested capital, Maxim's financials can easily be mistaken for those of a top-tier software company. In its fiscal 2005, Maxim achieved gross margin of 72%, operating margin of 47% (both before deducting stock option expenses), and return on assets close to 20%. Not only does its profitability outshine chip industry peers, it also rivals that of software giants Microsoft and Oracle.
in http://news.morningstar.com/article/article.asp?id=157493&pgid=wwhome1a
quinta-feira, janeiro 26, 2006
Buy Quality on the Cheap
By Shannon Zimmerman (TMF Zman) January 25, 2006
A quick check of the market's sale rack finds the following:
ExxonMobil (NYSE: XOM), Microsoft (Nasdaq: MSFT), Citigroup (NYSE: C), and Wal-Mart (NYSE: WMT) are all trading with trailing-12-month price-to-earnings (P/E) ratios that clock in below their respective industries' and their own five-year averages. Pfizer (NYSE: PFE), Johnson & Johnson (NYSE: JNJ), and Intel (Nasdaq: INTC) are trading at significantly discounted levels, too.
Which can only mean one thing, right? It's time to ...
Buy low! Sell high!
Just joshing. Indeed, that's one piece of investment "advice" that I suspect you've heard all too many times, and the only proper response to it is, "Well, duh." The real question, of course, is how to know if you're buying low and selling high, and one compelling way to answer that question is with discounted cash flow (DCF) analysis.
Show you the moneyRather than focusing myopically on earnings (which are easily fudged) or some kind of short-term market catalyst (which may never materialize), DCF analysis requires companies to show you the money -- literally.
By zeroing in on a firm's free cash flow (cash from operations less capital expenditures), making conservative assumptions about future earnings growth, and applying a discount rate (i.e., the return you require given a firm's business risk), you'll be in a good position to determine if a company is trading above or below its intrinsic value -- and within your margin of investing safety.
Follow the FoolThat's the tack that Philip Durell -- the Fool who leads the charge at our Motley Fool Inside Value newsletter -- takes each month as he scoops up two picks from the market's bargain bin for his subscribers. These are companies with loads of free cash flow (FCF) but whose stock is currently on sale.
One of Philip's picks, for example, is a beverage-industry behemoth that has delivered well over a billion dollars in FCF in each fiscal year since 1998 and currently trades at a P/E ratio below both its industry and that of the broader market. Another is a tech-industry titan whose current P/E is little more than half its five-year average -- despite the fact that it generated more than $4.7 billion of FCF in fiscal 2005!
Now what?The next time you think you've found a quality company at a can't-miss price, make sure it shows you the money. Using DCF analysis can help guide you to real cash and real promise -- for a real bargain.
And if you'd like to sneak a peek at Philip's full lineup of picks, just click here to take Inside Value for a risk-free spin. Your trial won't cost a thing for 30 days and will come in mighty handy, I suspect, as you go about the very important business of generating a little free cash flow of your own.
Shannon Zimmerman is the lead analyst for the Motley Fool Champion Funds newsletter service and doesn't own shares of any of the companies mentioned. Pfizer and Microsoft are Inside Value recommendations. The Fool has a strict disclosure policy.
A quick check of the market's sale rack finds the following:
ExxonMobil (NYSE: XOM), Microsoft (Nasdaq: MSFT), Citigroup (NYSE: C), and Wal-Mart (NYSE: WMT) are all trading with trailing-12-month price-to-earnings (P/E) ratios that clock in below their respective industries' and their own five-year averages. Pfizer (NYSE: PFE), Johnson & Johnson (NYSE: JNJ), and Intel (Nasdaq: INTC) are trading at significantly discounted levels, too.
Which can only mean one thing, right? It's time to ...
Buy low! Sell high!
Just joshing. Indeed, that's one piece of investment "advice" that I suspect you've heard all too many times, and the only proper response to it is, "Well, duh." The real question, of course, is how to know if you're buying low and selling high, and one compelling way to answer that question is with discounted cash flow (DCF) analysis.
Show you the moneyRather than focusing myopically on earnings (which are easily fudged) or some kind of short-term market catalyst (which may never materialize), DCF analysis requires companies to show you the money -- literally.
By zeroing in on a firm's free cash flow (cash from operations less capital expenditures), making conservative assumptions about future earnings growth, and applying a discount rate (i.e., the return you require given a firm's business risk), you'll be in a good position to determine if a company is trading above or below its intrinsic value -- and within your margin of investing safety.
Follow the FoolThat's the tack that Philip Durell -- the Fool who leads the charge at our Motley Fool Inside Value newsletter -- takes each month as he scoops up two picks from the market's bargain bin for his subscribers. These are companies with loads of free cash flow (FCF) but whose stock is currently on sale.
One of Philip's picks, for example, is a beverage-industry behemoth that has delivered well over a billion dollars in FCF in each fiscal year since 1998 and currently trades at a P/E ratio below both its industry and that of the broader market. Another is a tech-industry titan whose current P/E is little more than half its five-year average -- despite the fact that it generated more than $4.7 billion of FCF in fiscal 2005!
Now what?The next time you think you've found a quality company at a can't-miss price, make sure it shows you the money. Using DCF analysis can help guide you to real cash and real promise -- for a real bargain.
And if you'd like to sneak a peek at Philip's full lineup of picks, just click here to take Inside Value for a risk-free spin. Your trial won't cost a thing for 30 days and will come in mighty handy, I suspect, as you go about the very important business of generating a little free cash flow of your own.
Shannon Zimmerman is the lead analyst for the Motley Fool Champion Funds newsletter service and doesn't own shares of any of the companies mentioned. Pfizer and Microsoft are Inside Value recommendations. The Fool has a strict disclosure policy.
segunda-feira, janeiro 16, 2006
Análise Timberland

Uma das apostas mais fortes da carteira. Vejamos porquê.
Timberland é uma marca reconhecida em termos mundiais pela qualidades dos seus produtos (calçado e roupa) e lojas que se traduzem em margens de lucro médias superiores aos seus concorrentes directos.
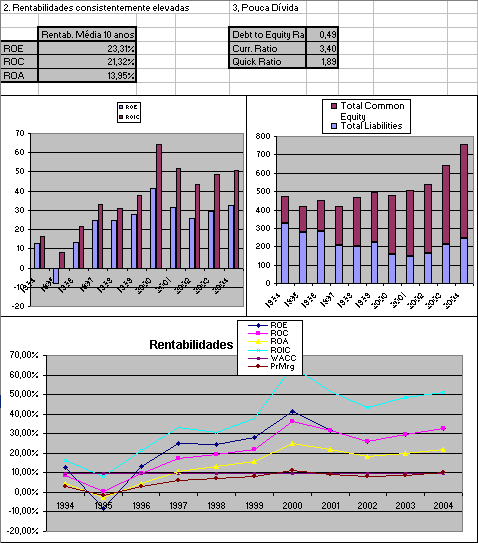
Rentabilidade média nos últimos 10 anos do capital próprio na ordem dos 23%, crescimento de resultados anualizados superior a 27% e rácios de solvabilidade muito conservadores (dívida praticamente inexistente).
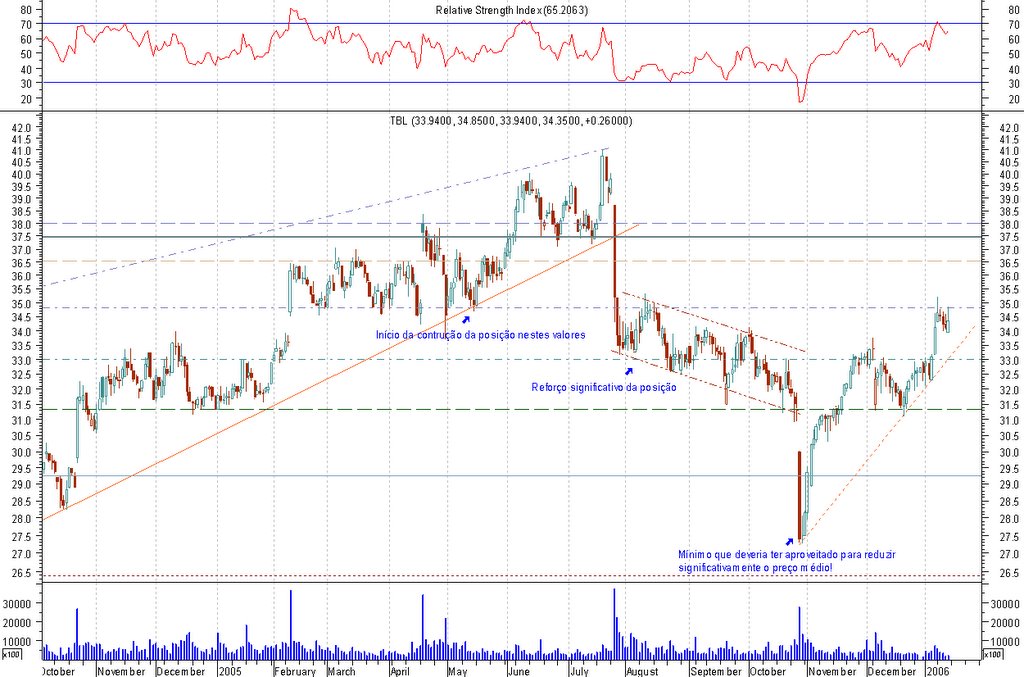
Comecei a entrar neste título em Maio do ano passado quando o título começava a entrar em máximos e com um sinal técnico bastante interessante. Teve uma apreciação assinalável que aproveitei para a realização de algumas (poucas) mais-valias. No entanto, em finais de Julho, na apresentação de resultados, os números anunciados desiludiram os investidores (com a valoriação do dólar as receitas oversees caíram) e as acções recuaram bastante. Aproveitei este recuo para reforçar de forma mais significativa a posição.
Julgo que assumi demasiado cedo uma posição muito pesada no título e aquando da divulgação de resultados no trimestre seguinte, que pela segunda vez consecutiva saíram abaixo das expectativas dos analistas, a acção voltou a recuar bastante e não pude entrar a esses preços mínimos visto já ter uma posição significativa no título.
A posição mantém e o título tem recuperado bem em direcção ao seu real valor intrínseco. A próxima apresentação de resultados está estimada para o dia 9 de Fevereiro.
Tenho por objectivo reduzir o peso deste título na carteira uma vez que acho ser demasiado para um negócio de resultados algo sazonais.
Ficam os dados fundamentais bem como o gráfico do título.



segunda-feira, dezembro 05, 2005
sexta-feira, outubro 14, 2005
Análise Lexmark
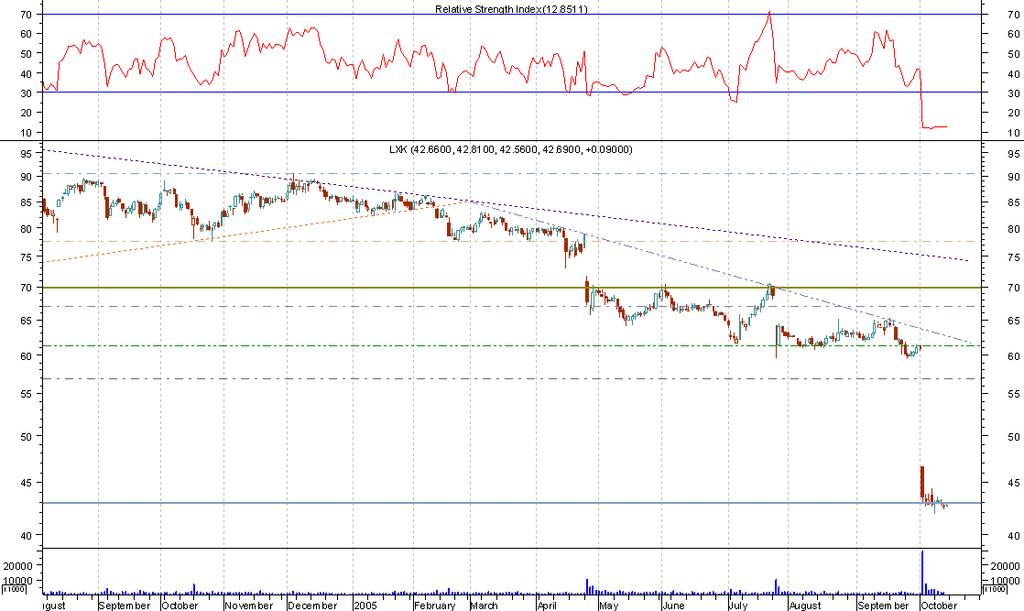
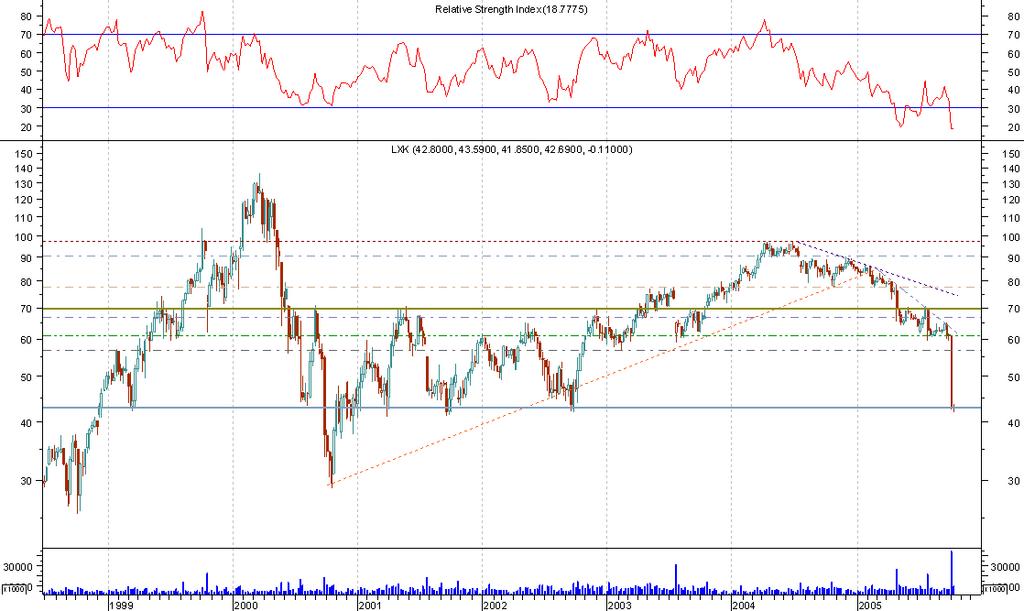
A segunda marca mundial de impressoras vem comunicando reduções sucessivas nas vendas e correspondentes lucros. A grande rival, a HP, tem vindo a pressionar bastante os preços numa estratégia de reestruturação que envolve despedimentos de pessoal, fecho de departamentos e reduções de preços e margens. No entanto, estas reduções não são sustentáveis e a estabilidade há-de regressar ao sector.
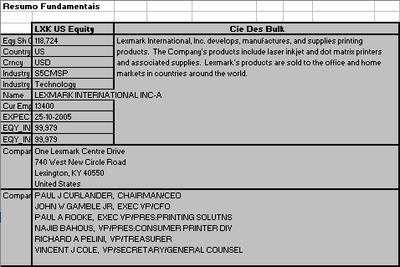
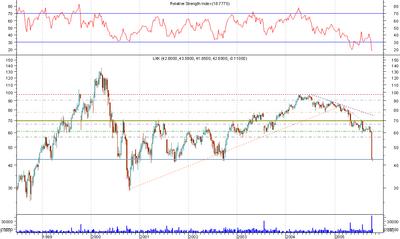
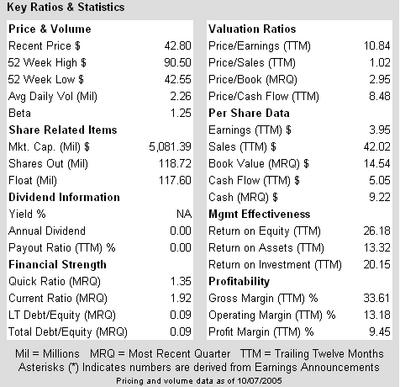
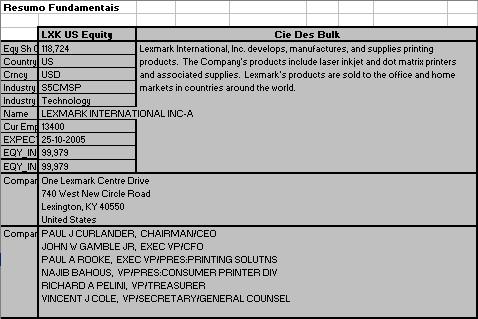
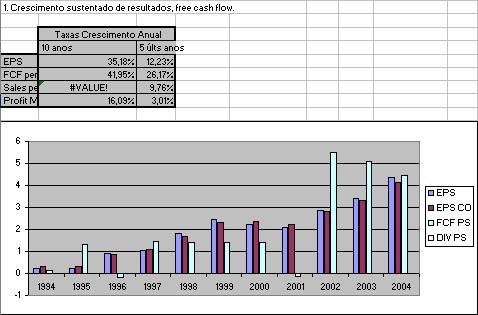
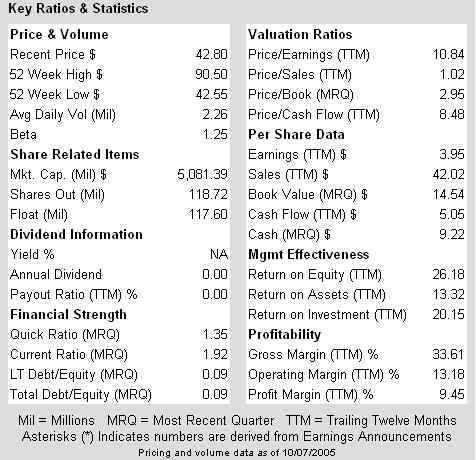
A Lexmark possui um historial de resultados muito bom como podem comprovar os dados fundamentais abaixo. Por outro lado, só este ano já caiu quase 50%! Os múltiplos encontram-se em níveis historicamente baixos.
Neste momento tenho uma posição de $3000 mas vou reforçar.
Ficam os dados fundamentais, os gráficos, uma avalição do seu valor intrínseco recorrendo ao modelo dos free cash flows descontados e os movimento efectuados até hoje.


Avaliação do Valor Íntrinseco da Lexmark assumindo um custo do capital de 9.93% e uma LT Growth Rate de 10.5% durante 10 anos.


Através deste método podemos concluir que cada acção da Lexmark vale $99.57, ou seja, 133.95% acima do preço actual!
Ficam os movimentos no título:

A Lexmark possui um historial de resultados muito bom como podem comprovar os dados fundamentais abaixo. Por outro lado, só este ano já caiu quase 50%! Os múltiplos encontram-se em níveis historicamente baixos.
Neste momento tenho uma posição de $3000 mas vou reforçar.
Ficam os dados fundamentais, os gráficos, uma avalição do seu valor intrínseco recorrendo ao modelo dos free cash flows descontados e os movimento efectuados até hoje.

Avaliação do Valor Íntrinseco da Lexmark assumindo um custo do capital de 9.93% e uma LT Growth Rate de 10.5% durante 10 anos.
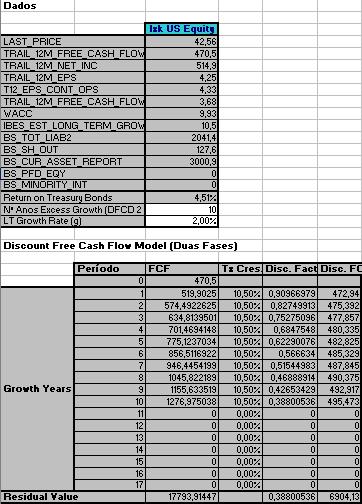

Através deste método podemos concluir que cada acção da Lexmark vale $99.57, ou seja, 133.95% acima do preço actual!
Ficam os movimentos no título:

Subscrever:
Mensagens (Atom)