quinta-feira, julho 28, 2005

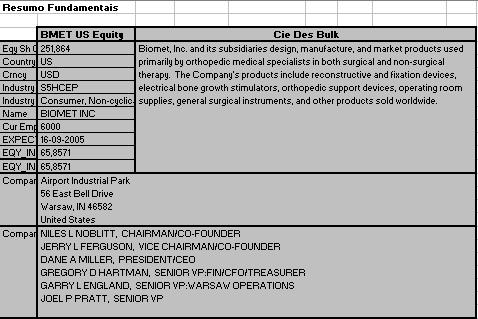
Análise Biomet

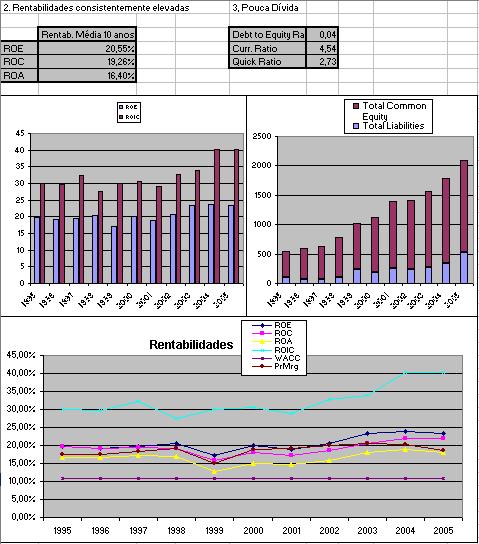
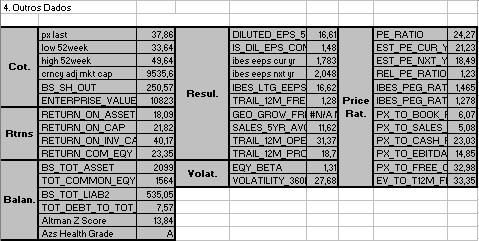
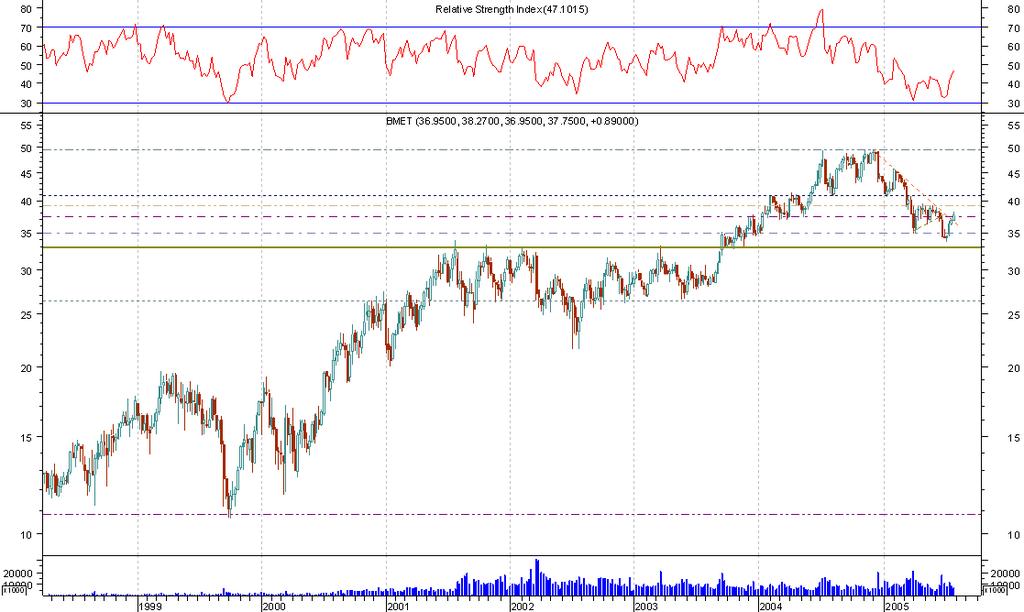
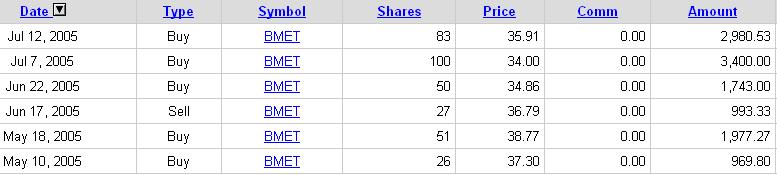
Uma excelente empresa com grandes perspectivas futuras afectada por questões técnicas de curto prazo e notícias negativas no que diz respeito a eventuais aliciamentos, já negados pela empresa, de médicos para subscrição dos seus produtos. Representa praticamente 10% da carteira e espero mantê-la e às suas rentabilidades por muito tempo.

Fica a análise fundamental, a técnica e os movimentos efectuados no título.


PS: Continuo a reforçar na Timberland (na zona de suporte dos 34) e vendi um pouco de AIG. Amanhã volto a publicar a carteira actualizada.

sábado, maio 21, 2005

Buffetology

O melhor livro sobre o método de investimento de Buffet elaborado com a colaboração de uma sua ex-nora.

Buffettology: The Previously Unexplained Techniques That Have Made Warren Buffett The Worlds

Americans are infatuated with the stock market. The number of households that own stock has increased from around 20 percent in the early 1980s to over 40 percent today. The market offers the hope of quick wealth and early retirement, and just about everyone who is in the market is looking for an edge, from sources such as CNBC and Wall Street Week to the Beardstown Ladies and "The Motley Fool." So it should be no surprise the most successful investor of our time--Warren Buffett--has been the subject of dozens of books and magazine articles. The value of Buffett's company, Berkshire Hathaway, has increased from $18 per share in 1965 to over $70,000 per share today. The interest in Buffett has spawned an approach to investing called "Buffettology," which is the subject of a book by the same name written by Buffett's former daughter-in-law, Mary Buffett.
In Buffettology, Mary Buffett, with the help of David Clark, details Warren Buffett's approach to investing. It's a style of investing based on the work of Benjamin Graham and one that requires a quality that most investors lack--discipline. Mary Buffett writes, "As you read through this book you will come to see that having a business perspective on investing is more about discipline than philosophy.... In short, other people's follies, brought on by fear and greed, will offer you, the investor, the opportunity to take advantage of their mistakes and benefit from the discipline of committing capital to investment only when it makes sense from a business perspective.... You will find that almost everything that relates to business perspective investing is alien to Wall Street folklore.

Buffettology examines Buffett's methods for valuing companies and selecting stocks--it even encourages you to buy a calculator and work through the valuation formulas that Buffett uses when researching companies to buy. The book not only serves as a useful guide to understanding how Buffett invests, it's an excellent primer to investing in stocks, whether you plan to become a Buffettologist or not. Highly recommended. --Harry C. Edwards, Business editor--This text refers to the Hardcover edition.

Review
Stevin Hoover Hoover Capital Management
Absolutely the best book ever written on Warren Buffett's investment methods.

Outros Livros:
The New Buffettology by Mary Buffet
The Warren Buffett Way, Second Edition by Robert G. Hagstrom
How to Think Like Benjamin Graham and Invest Like Warren Buffett by Lawrence A. Cunningham
The Warren Buffett Portfolio : Mastering the Power of the Focus Investment Strategy by Robert G. Hagstrom
The New Buffettology: How Warren Buffett Got and Stayed Rich in Markets Like This and How You Can Too! by David Clark
Trade Like Warren Buffett (Wiley Trading) by James Altucher

A minha análise fundamental!

Aprendi finanças na Faculdade de Economia do Porto. Balanço, Demonstrações de Resultados, Cash Flows, Múltiplos de Mercado, ...

No entanto, toda essa matéria dada em série aos alunos só começou a fazer sentido quando comecei a vasculhar em livros e artigos (muito mais práticos do que os manuais da Faculdade) sobre o método de investimento fundamental utilizado por Warren Buffet (este inspirado pelos ensinamentos de Benjamin Graham). Aí tudo se simplicou na minha cabeça. Descobri um guia, uma linha de pensamento que me organizou e instituiu um método.

Nos próximos posts vou falar sobre esses ensinamentos...

terça-feira, maio 17, 2005

Stock Market Lies

Stock Market Lies
By Richard Gibbons May 2, 2005

Value investors are independent thinkers. They don't need the crowd to validate their ideas, nor do they act contrarian simply for the sake of being different. While Sun Microsystems (Nasdaq: SUNW) and JDS Uniphase (Nasdaq: JDSU) were zooming up at the height of the tech bubble in the late 1990s, Warren Buffett was criticized as being out of touch with the realities of the new economy. Now that the bubble has popped, Buffett's company, Berkshire Hathaway, is close to all-time highs, while Sun and JDS Uniphase investors have been slaughtered.

Buffett wasn't avoiding technology just to be a contrarian. Berkshire's portfolio has piles of great businesses bought at reasonable prices, not just cheap businesses bought when nobody else wanted them. Companies like American Express (NYSE: AXP) and Moody's (NYSE: MCO) can hardly be considered cigar butts, but they've made Buffett wealthy nevertheless. Buffett's success can be attributed to well-reasoned purchases made within an investing framework based on value principles.

This approach sharply contrasts with most of the financial industry, which is why it is an interesting exercise to examine, from a value perspective, the disinformation that the financial industry pitches at investors every day.

"If you were out of the market for the best 30 days in the past decade, you would have lost money."
Mutual fund advisors often use this statistic to urge investors to stick with them for the long term, despite the fact that advisors themselves tend to be traders -- the typical managed mutual fund has an average turnover rate of 85%. But while being shocked and appalled at such hypocrisy is an entertaining hobby, it's also worthwhile to analyze the reasoning behind the claim.

The statistic is accurate: $10,000 invested in the S&P 500 a decade ago grew to almost $25,000 today (excluding dividends), while without the best 30 days, it would be worth only $7,700. But before making conclusions about market timing, consider the opposite statistic: If you were out of the market for the worst 30 days, you would have made $76,000. If the first statistic is saying that you should remain invested at all times, this statistic seems to be saying that trading to avoid bad days is critical. What gives?

Neither case is accurate. Rather, the statistic is used as propaganda to help fund companies pitch their funds and discourage investors from selling. There are many good reasons to be a long-term investor, including tax-free compounding, reduced expenses, and reduced risk. But this statistic is not a good reason.

What do these statistics mean to the individual investor? It's not clear, except that if you're a trader, some bad or good luck on a few select days could have very dramatic effects on your portfolio. But as a value investor, I think of some potential benefits of a margin of safety. By buying a stock at a discount to its intrinsic value, I'm likely to avoid the worst of the fallout on those worst 30 days, and my long-term performance should be superior.

"The trend is your friend."
This catchy one-liner reflects the momentum that stocks gather: Stocks going up tend to keep ascending, while stocks going down tend to keep falling. The logic driving the claim is a combination of psychology and faith. The psychology is that investors would prefer to buy a stock that's going up and therefore keep pushing it up. The faith is the belief that if something's going up, there must be some reason for it, so it will probably continue to do so.

This reasoning might work for day traders, but it is quite bizarre from a value perspective. First, if a stock is going up, then, all else being equal, it becomes less attractive to value investors because it is approaching -- or exceeding -- its intrinsic value. The upside is less and the downside is greater. Conversely, a stock going down becomes more attractive because both the margin of safety and potential return increase. Value investors love to buy goods when they're on sale. So the trend isn't a value investor's friend, but actually an enemy, like an evil maharaja, Jar Jar Binks, or a berserk koala.

The value investor's true friends are competitive advantages and a margin of safety. Competitive advantages ensure that the company will outperform others for a long time, while a margin of safety dramatically reduces the chance that the value investor will suffer significant losses.

"Run your profits, cut your losses."
This expression is the bedfellow of the "friendly trend" from above -- and with such a nickname, it has many bedfellows, including "buy high, sell higher" and "don't catch a falling knife." It means that if you're making money on an investment, don't sell quickly, but if you're losing money, then run for the hills. Frequently, it's implemented with some sort of stop-loss rule, such as "sell any stock that falls by 10%." The idea holds some appeal, since if you have the same number of winners and losers, but make more on the winners, then you will come out ahead.

However, this reasoning trips over the same stumbling block as momentum investing: It ignores valuation. If a stock has fallen 10% below your purchase price, that does not imply anything about the intrinsic value of the company. If the stock is down on negative news that decreases your estimate of intrinsic value, such as Merck (NYSE: MRK) after its Vioxx withdrawal, or Doral (NYSE: DRL) taking a hit to its balance sheet and changing its business model because of troubles with interest-only strips, then it makes sense to reevaluate the position.

But if the stock falls with no fundamental change, or falls further than is justified by the change in the intrinsic value, then a value investor would be more inclined to increase the position than decrease it. After all, the upside has become bigger and the downside smaller. The intrinsic value of Martha Stewart Living Omnimedia (NYSE: MSO) fell when Martha Stewart went to court, but the share price declined far more than the intrinsic value. Now that the homemaker's troubles seem to be behind her, shareholders who bought during the trial have tripled their investment.

"The market is always right."
Traders say this when the market is not doing what they expect it to do. It generally means that the trader believes his or her reasoning to be incorrect, since the market isn't acting as planned. Consequently, the traders should cut their losses. I love this expression because it's so pessimistic. It reminds me of Eeyore, blue-grey donkey and portfolio manager: "I was just kind of guessing where the stock was going anyway, and I was wrong. Oh, well."

Value investors think this expression is quaint. The market is right occasionally, but overall it tends to be pretty bipolar, with individual stocks priced both above and below intrinsic value. Really, if a stock is priced at less than the discounted value of its expected future returns, then the market is wrong. In such cases, value investors are able to make extraordinary profits both from long-term growth in the business and from the stock returning to intrinsic value. In fact, identifying such stocks is Motley Fool Inside Value's primary goal.

In conclusion
Many common investing expressions don't hold up when examined from a value perspective. However, this can be a great thing, as those who do believe in such maxims may push stocks away from intrinsic values, providing an opportunity for value investors to profit.

Profit From Panic

By Richard Gibbons
April 15, 2005

The mission of Motley Fool Inside Value is simple: We want to find companies trading at prices less than their fair value. In some cases, companies are below fair value simply because the market has failed to appreciate the sustainability of a company's competitive advantage. At other times, companies fall below their fair value during a crisis, when panicked investors flee.

The latter case has the potential for quick returns, but also comes with greater risk. When looking at companies in crises, such as AIG and Doral Financial (NYSE: DRL) right now, it can be challenging distinguishing between a company just suffering a flesh wound and one on its deathbed.

When you do identify a potential turnaround, it can be quite lucrative. Consider Martha Stewart Living Omnimedia (NYSE: MSO). When Martha Stewart's insider-trading fiasco first made the news, it was possible to pick up shares at less than $7. These shares traded above $35 this year, for a pleasant 400% return. Much larger multibaggers over the course of years are easily within reach. The difficulty, though, is determining who will survive and prosper. With that goal in mind, here are some of the issues I consider when trying to profit from panic.

LiquidityIn a crisis, cash gives a company the time and flexibility to survive a rough patch and reorganize its business. It's critical to get a good feeling for the degree to which cash on the balance sheet and future cash inflows are able to cover future cash outflows. Of course, the event causing the crisis often reduces operating cash flows, so using historical cash flow numbers can be deceptive. Instead, start with historical numbers and come up with a pessimistic approximation of the extent to which the negative event will impact cash flows, and how much cash outflows can be reduced over the short term, through, say, delaying capital expenditures.

If the company is close to the edge, there's a good chance it will topple over, so it should be avoided.

Even if the cash flow looks good, another liquidity issue to consider is debt. Even if it seems clear to shareholders that the company has enough cash flow to survive, banks and other lenders can be skittish. So it's a good idea to examine absolute levels of debt and future debt maturities. If the company is highly leveraged, or a substantial portion of its debt is coming due in the next few years, then the company may be unable to roll that debt over to future maturities. Often, it's not the slow draining of cash resources that leads to bankruptcy, but rather a large debt maturity that the company is unable to roll over or repay.

Asset strengthWhen it comes to turnarounds, the balance sheet can count more than the income statement. I've already talked about debt. Another factor to consider is the strength of the assets, because all assets are not equal. Cash is the best asset, since it gives maximum flexibility.

Other good assets include securities and non-depreciating physical assets that can potentially be sold, such as real estate. Because of the rules of accounting, real estate can be particularly strong because it may be listed on the balance sheet at significantly less than its present value.

However, there are also bad assets that generally cannot easily be sold or generate cash. Such assets include goodwill and tax assets. Goodwill is useless because it's intangible, while tax assets can only be converted into cash when the company has operating profits, generally after the crisis has passed. So when considering a company's survival prospects, it's best to heavily discount the value of these assets.

The competitive positionPreferably, we're buying the beaten-down company not just for its assets but also for its future operating performance. Ideally, the company is suffering from temporary bad news, but its long-term competitive position is intact. Maybe the company will show poor results for a year or two, but is likely to prosper after that time. Or perhaps the company has suffered a permanent setback but is still strong enough to be a viable business.

In late 2001, terrorism fears hit the travel industry. At the time, people were talking about how far the airlines would fall, and which airlines would survive. But really, the travel recovery play wasn't in airlines. Sure, people who perfectly timed AMR's (NYSE: AMR) crisis in 2003 could have earned 500% returns. But they would have been assuming a lot of risk buying into an extremely volatile industry with fleeting competitive advantages.

Instead, the simple and safe travel industry play was the hotels. Hotels have competitive advantages both in terms of location and brand. Plus, hotels often own real estate that can provide a cushion to help avoid liquidity concerns. A September 2001 purchase of Starwood Hotels and Resorts (NYSE: HOT) or Hilton Hotels (NYSE: HLT), two of the largest hoteliers, would have returned 100% within a year, or 200% had you decided to hold until now.

Bringing it togetherA good example of all these issues is National Health Investors (NYSE: NHI), a REIT that primarily owns nursing homes. As you can see in this chart, National Heath Investors was flying along quite happily when it hit the perfect storm. The Balanced Budget Act of 1997 cut Medicare revenues to its nursing home operators, the companies that lease National Health Investors' buildings. Consequently, many operators went bankrupt. Plus, it was affected by overbuilding and labor shortages. Finally, lawsuits in Florida were destroying the business there.

Confronted with these challenges, National Health collapsed like Mr. Bean sparring with Evander Holyfield. I became interested, and bought some at $15. This was a wee bit early, since it cratered below $5 when the company discontinued its dividend only six months later. But this wasn't a technology company. It had solid real estate assets in a time of falling interest rates.

Cash flow was still positive. The entire industry was unlikely to vanish: Somehow, someone would take care of the elderly. So I bought more at $5, and it started to look like the industry was recovering.

But National Health owed money to the banks. And the banks panicked, demanding repayment. So National Health was forced to sell convertible preferreds at a time when the stock was low, diluting existing shareholders. I bought more in the $6 range. Cash flow was still good, nursing home operators were coming out of bankruptcy, and the balance sheet, never really overleveraged to begin with, now looked quite clean. It was difficult to see how National Health could fail.

Now, four years later, the stock is trading around $25. That's lower than it would be if it hadn't been forced to issue the convertible, but it's still a decent return. For months, value investors bought in the $6 range, and those investors have seen a 400% return. What's more, since National Heath has a $1.80 dividend, investors at $6 are now seeing an annual dividend of 30% on their original investment. I sold out at $22.

The keys in this case were that cash flow was positive, leverage was reasonable, the assets were strong, and there were signs that the industry would turn around. Even then, the debt maturity hurt shareholders significantly, because nobody wanted to lend to companies in the sector. This is why, when analyzing these turnaround situations, it is critical to consider debt maturities.ConclusionEvaluating these factors can help you find and identify turnaround plays that lead to extraordinary profits. For instance, in 2002, both Philip Durell, Inside Value's chief analyst, and I independently recognized that Providian Financial (NYSE: PVN) had a decent chance of rebounding, and we both bought well under $5. It's now around $17. If you want to learn about what Philip sees as the great value plays right now, and see all of his historical recommendations, a free 30-day trial is available. Or, for a limited time, Philip is offering Inside Value at a 25% discount to the regular price. To find out more, click here.
Selecting Stocks Using ROE

Have you ever wondered why two similar companies can have vastly different prospects and returns? You could look at earnings per share, but knowing if a company is underperforming is less important than figuring out why. Breaking apart return on equity can determine that a company's operations are improving before the market notices.

By Bill Mann (TMF Otter)
April 28, 2004

Ever wonder why some companies succeed while similar companies fail to generate the same returns for shareholders? One of the key elements is a company's ability to turn the shareholder equity it holds into profits. It's one of the key elements that Mathew Emmert looks for in his dividend-paying stocks featured in Motley Fool Income Investor. In fact, it's an element that every investor should keep in the ol' toolbox for evaluating securities.

It doesn't get the same treatment as earnings per share, it doesn't gain much cult status like free cash flow, and you'll never, ever hear the folks on Bubblevision using the term. But return on equity (ROE) matters. It shows how good a company is at generating money based on the retained shareholder equity, also known as money that the company could return to you. This is an important number for dividend payers as it shows how well the company is generating returns for the next dividend. A consistently low ROE is a sign that the company's management isn't effectively deploying the resources at its command.

Moreover, relative return on equity within an industry can tell investors which companies are well run, and which are not. Ever wonder why Ralph Lauren (NYSE: RL) was such a lousy investment for so many years even though everyone seemed to have one or two pieces of Polo clothing in their closets? Look no farther than a chronically anemic ROE.

The basic calculation for return on equity is dazzlingly simple: net income divided by shareholders' equity (book value). But this calculation hides some more nuanced information that not only indicates a company is generating poor returns, but also why. The return on equity calculation, as simple as it appears, is actually a combination of several critical components relating to profit margins, asset turnover, debt, and debt servicing. Break this calculation down into its elements and you'll get an astounding amount of information about a company, its trends, and its performance relative to its competition.

Permit me to demonstrate by looking at two similar companies: American Eagle Outfitters (Nasdaq: AEOS) and Abercrombie & Fitch (NYSE: ANF). American Eagle has 800 stores, Abercrombie 700. American Eagle's trailing 12-month revenues exceeded $1.5 billion, Abercrombie's $1.7 billion. These are not huge differences, and yet Abercrombie is valued 50% higher than American Eagle Outfitters. One hint why: Abercrombie & Fitch has an ROE exceeding 25%, while American Eagle Outfitters' is less than 10%.

Does this mean that the companies' book values are wide apart? Again, no -- they are quite close. Obviously, the return component for American Eagle is far inferior to that of Abercrombie. Let's dig in and figure out why. Keep in mind this formula for ROE: [(operating profit margin)(asset turnover) - (interest expense rate)](leverage)(tax retention rate).

Item 1. Operating profit marginSimple enough. By dividing EBIT (earnings before interest and taxes) by sales, you find out how much money the company made from operating activities before the taxman and the noteholders get their lucre, and you want to see how much in revenues it took to generate this amount. A company could sell billions of dollars' worth of product, but if its expenses consistently equal or exceed its revenues, it's more like a turnstile than a business. Right out of the gate, we can see a big discrepancy between our two case-study companies. Abercrombie has an operating profit margin of 19.4%, while American Eagle's is 6.9%. At those rates, it would take American Eagle nearly three times the sales to generate the same gross operating profit.

Item 2. Asset turnoverI love this measure -- it's where places like Costco (Nasdaq: COST), Claire's (NYSE: CLE), and Home Depot (NYSE: HD) really shine. Compared to the level of assets, how much in revenues did the company generate? So we use this formula: sales divided by average assets. (Note we're talking average assets, not the raw number at the end of the reporting period.) For American Eagle, the turnover is 1.89 times, while for Abercrombie it's 1.53 times, so American Eagle is actually better in this regard.

Item 3. Interest expense rateRemember, in Item 1 we backed out interest payments. That's because we want to be able to view leverage separately from operations. If a company is operating well but is simply drowning in debt, that would be useful information -- and if in future periods you notice the debt level dropping, you might have yourself an underappreciated stock. Stranger things have happened. What we're looking for here is how much interest the company is paying to maintain its asset base, so the formula is interest expense divided by assets. Abercrombie, rather than paying interest, generates it from the cash in the bank, so it actually has an interest expense rate of negative 0.3%. Ditto American Eagle, which comes in at minus 0.4% Nice.

Item 4. LeverageWait a minute, didn't we just get finished determining that neither company had any interest expenses? I guess that means we can scribble in a zero for both and move on, right? Not so fast. While neither had interest-bearing debt, both have plenty of operating, short-term leverage -- accrued expenses, accounts payable, even unredeemed gift cards. Still, this component's pretty simple to calculate. The formula is average assets divided by average shareholders' equity (remember the average part). American Eagle comes in at 1.31, while Abercrombie & Fitch is 1.37 times -- nearly identical.

Item 5. Tax retention rateCan you hear Billy Bragg talking with the taxman about poetry? No? Well, Uncle wants his cut, and although we'd love to be able to quote returns net of tax, that doesn't really capture the whole picture. The calculation here is the reciprocal of the tax bite, that is: 1 minus the tax rate. To calculate, take the provision for income taxes and divide it by the income before income taxes, then take this sum and subtract it from 1. Abercrombie's tax rate is 38.8%, so its retention rate is 61.2%. American Eagle's tax rate is 43.4% (yikes!), so it retains 56.6%.

In sum we have the following equations:

Abercrombie & Fitch:[(0.194)(1.53)-(-0.003)](1.37)(0.612) = 0.2514, or 25.1%

American Eagle:[(0.069)(1.89)-(-0.004)](1.31)(0.566) = 0.0997, or a smidge below 10%

A look at most of these component numbers shows something striking. They're dramatically similar for the two companies with one glaring exception -- operating profit margins (though, I must admit I'm a bit perplexed by the high tax rate at American Eagle). Abercrombie is far more efficient at keeping costs down, and it shows in net profits -- and in return on equity.

Here's where else it shows: On marginally higher annual sales, Abercrombie is valued at a billion dollars more in market capitalization than American Eagle. What's tougher for American Eagle shareholders is that the ROE has declined from well above 29% in 2001 to today's 10%. You can see this trend quite clearly in the most recent 10-K with the company having added more than 10% new retail space only to capture 3.9% higher revenues.One thing to keep in mind is that companies granting tons of stock options without expensing them (neither of the two in the example) can skew results in two ways. First, earnings -- the numerator -- will be overstated.

Second, many companies counteract the impact of options dilution by buying back shares. The money for this comes straight from the equity account, so the denominator may be substantially understated. I always read the management discussion and add back every penny to equity that was used to buy back shares to hide dilution. They don't call it shareholders' equity for nothing.

Risky Business?

By Mike Klein
May 10, 2005

Risk isn't easy to define. I won't skydive, even if the data says my parachute will open every time. The downside is just not OK with me. But other people do it all the time -- they accept the risk. Some people won't fly on airplanes, but to me the data shows it's one of the safest forms of transportation. That let me fly to Omaha for the Berkshire Hathaway annual meeting.

There is a lot made about investing risks. Much of this is to sell you investment products that make money for someone else. But there is a simple investing strategy that reduces risk and delivers market-beating results. Read on...

You can't beat the marketThe investing concepts of risk/return trade-off, diversification, and the inability to beat an efficient market all have their roots in a 1952 paper written by MIT economics graduate student Harry Markowitz titled "Portfolio Construction." Markowitz set forth the relationship between returns and volatility, concluding that investors must subject their portfolios to higher volatility in order to earn higher returns. He also found that strategic diversification -- based on reducing correlation between investments -- reduces a portfolio's volatility but also cuts into gains. Markowitz won a Nobel Prize for his work.

His ideas have taken hold in the financial world, far beyond what Markowitz ever dreamed. You can see those ideas at work when the Wall Street elite talk about asset allocation, risk tolerance, and efficient markets. Your local financial planner will probably tell you that owning individual stocks is risky and that you should invest in index funds and diversify still further with bonds and cash. Furthermore, you will hear that in the long run, you cannot beat the market.

Return without the risk?Markowitz may have won a Nobel Prize, but Warren Buffett has beaten the market soundly for 50 years running. The handful of other investors who use Buffett's basic principles have market-beating records of 20, 30, or more years. What's more, Buffett and those who follow his principles have achieved their gains without subjecting themselves to enormous risk. How can this be? Are these accidents, freaks of probability, or luck?

None of the above. These extraordinary investors have told us for decades how they achieve their results. Charlie Munger, Berkshire Hathaway's vice chairman and Buffett's business partner, didn't mince words last year: "Diversified portfolios are madness! It's taught in all the business schools, and it's wrong." Excuse Charlie for being blunt, but he sure gets his point across, and he's right.

What's the secret?How can an individual investor achieve great returns while cutting risk? Let's detour for a moment to understand why investment firms sell diversification. They need to make a consistent profit to keep their own shareholders happy. In the 1970s, seeing the opportunity to sell a broad range of products under the guise of diversification, brokerages latched onto Markowitz's ideas and commercialized them.

Investment houses sell investing as a science -- follow our formula and you'll do fine, they say. They collect 1% or 2% a year to let you use their science, whether or not your investments perform well. And the more you trade -- in accord with their science -- the more they make in commissions. This approach achieved two things for these firms: they got more money to manage and they tapped a consistent source for revenue and profits. Unfortunately, this approach prevents people like you and me from getting the best possible return on our money.

Volatility is your friend!The most important difference between Buffett, Munger, and other value investors and Markowitz's followers is their definition of risk. In most of the financial community, stocks that go up and down a lot are considered "risky." Cisco (Nasdaq: CSCO), JDS Uniphase (Nasdaq: JDSU), and all manner of troubled companies are examples. Wall Street trades these stocks under the assumption that you have to ride the wave of these volatile stocks to get great returns -- all the while ignoring whether these companies are financially sound.

Conversely, Buffett and other value investors buy stock in high-quality companies when they are selling for less than they are worth. Value investors wait patiently for volatility to bring the stock price down well below its true value, then they buy it. In other words, they use volatility to their advantage. With this strategy, volatility can be used to lower risk! That's completely opposite conventional wisdom.

So where's the risk? There has to be some -- but when you buy shares for less than they're worth, there isn't as much of it. The stock could fall more, but it's much more likely to go up. The risk is even further reduced by considering only high-quality companies. Buffett loves it when the markets slide because it lets him find great companies selling at discount prices. That is value investing in a nutshell, and it works.

Diversification? Or diworsification?According to Markowitz, diversification reduces risk. But Markowitz looked only at volatility. He didn't examine buying stocks at a discount or the quality of a company. By using the principles of value investing, we reduce risk by buying low and considering only good companies. That changes the assumptions underlying the trade-off between risk and reward and reduces the need for the products investment firms try to sell.

Some diversification is still important to ensure that if something very unusual happens to one or two stocks, your portfolio isn't wiped out. But instead of needing to own a broad index fund, or hundreds of stocks, you can diversify with 10 to 20 well-picked stocks. For starters, a free trial to Motley Fool Inside Value will provide a list of attractive investments, along with intelligent analysis and commentary on the active Inside Value discussion boards.

Find attractive value stocksFrequently, stock prices are pushed down by the overreactions of short-term investors. Look no further than pharmaceutical giants Merck (NYSE: MRK) and Inside Value pick Pfizer (NYSE: PFE) for evidence. While they have had real problems recently, investors have overreacted and the stocks are good buys today for long-term owners. The stock of soft-drink behemoth and Inside Value recommendation Coca-Cola (NYSE: KO), with brand-name strength and a global distribution network second to none, is also selling at unusually low prices. Although we have yet to hear the second shoe drop, AIG (NYSE: AIG) is a fundamentally solid business whose stock price has been punished by short-term events.

Motorcycle maker Harley-Davidson (NYSE: HDI) is another potential example: a great brand with growing revenues, excellent profitability, a strong balance sheet, and a unique product.

Harley's stock was knocked down about 20% a couple of weeks ago because of a reduced earnings forecast.The hardest part of value investing is figuring out what a stock such as AIG is worth. This is where Inside Value comes to the rescue. Every month, Philip Durell recommends two stocks that have passed his rigorous value screening and analysis based on business fundamentals. His past picks range across industries and provide the only diversification a portfolio needs: 20 high-gain, low-risk companies.