quarta-feira, novembro 22, 2006

Análise Apollo Group (APOL)

Os mercados estão em máximos mas ainda há valor a excelentes preços. A Apollo Group gere universidades nos Estados Unidos e possui um negócio de ensino Online. Com uma dívida reduzida e um historial de rentabilidades impressionante e revelador do elevado potencial deste sector de actividade protegido por decretos estatais que lhe atribuem qualidades de monopólio nas regiões onde estão presentes, a Apollo está a cotar na sua avaliação mínima de sempre. A 14 vezes os resultados estimados para o próximo ano, é sem dúvida uma excelente compra...


When Genius Failed: The Rise and Fall of Long-Term Capital Management

História fantástica e muito bem relatada por Roger Lowenstein sobre a queda do Hedge Fund Long Term Capital Management. Fundado em 94 por John Meriwether, contava no Conselho da Administração com dois prémios nobel de 97: Myron Sholes e Robert. C. Merton. Com um capital próprio inicial de cerca de 1 bilião de dólares, teve uma performance extraordinária até aos inícios de 98 quando valia 4.6 biliões. Tudo perdido em menos de 4 meses.

A Teoria dos Mercados Eficientes colocada em prática e levada ao extremo!
A ideia de que todo o risco é controlável!
O problema dos pressupostos teóricos que condicionam invariávelmente as conclusões!
Os instrumentos derivados e a alavancagem como armas de destruição financeira maciça!

Uma história incrível, que ilustra exemplarmente como a ideia de certeza nos mercados financeiros pode conduzir a estragos consideráveis.

Serão os mercados eficientes?

"The market can stay irrational longer than you can stay solvent."
John Maynard Keynes

segunda-feira, outubro 30, 2006

The Superinvestors of Graham-and-Doddsville

Intemporal artigo do Warren Buffet onde salienta com recurso a evidência empírica como é possível, recorrendo à estrutura de análise e avaliação de activos defendida por Graham e Dodd no seu livro Security Analysis de 1934. O investimento em valor recorrendo a métodos de análise perfeitamente identificados e muito divuldados aliados a uma estrutural mental correspondente produz, numa série de exemplos enunciados por Buffet, retornos bastante razoáveis acima da média do mercado, recorrendo, na maior parte das vezes a ideias de investimento diferentes. No entanto, em todos estes Superinvestidores a ideia fundamental de investimento mantém-se: comprar activos subavaliados em relação ao seu valor intrínseco, salvaguardados por uma margem de segurança e independentemente das condições de mercado.

De realçar igualmente a crítica directa aos modelos téoricos de mercados eficientes (risco tem a ver com a o desconto ou prémio a que se compra um activo em relação ao seu valor intrínseco e não a volatilidade do mesmo) e a modelos de análise de variações e volumes (análise técnica).

Pode consultar o artigo aqui.

sexta-feira, setembro 08, 2006

"Stocks For The Long Run" (1994) by Jeremy Siegel

A professor at the Wharton School of Business, Jeremy Siegel makes the case for - you guessed it - investing in stocks over the long run. He draws on extensive research over the past two centuries to argue not only that equities surpass all other financial assets when it comes to returns, but also that stock returns are safer and more predictable in the face of the effects of inflation.

sexta-feira, agosto 11, 2006

Lynch & Buffett: What's In Your Wallets?

Lynch & Buffett: What's In Your Wallets?
John P. Reese, Validea Hot List 08.11.06, 6:00 AM ET

Capital One Financial has some funny advertisements (at least some people think they're funny), such as those with comedian David Spade. But there's no joking about how this financial institution is growing and making money.

Recently, I wrote in this column about the strategies I use based on Warren Buffett's and Peter Lynch's approaches to investing. These are both great strategies, and they both think that Capital One is laughing all the way to the bank.

What is Capital One (nyse: COF - news - people )? It was a major issuer of credit cards and still is. It used to focus on sub-prime borrowers, but refocused a few years back and now attracts better-quality customers. Yet again, however, it is redirecting itself by entering the banking business. Just last year, it purchased Louisiana's Hibernia National Bank and is currently completing the purchase of New York's North Fork Bancorp. (nyse: NFB - news - people ). The advantages of owning banks are that they bring in relatively cheap deposits and diversify the company's revenue base.

Upon completion of the North Fork acquisition, Capital One should be among the ten largest banking companies in the country. Also, it recently posted earnings that disappointed Wall Street and knocked more than 10% off the stock's market value.

This setup means that in Capital One we have a strong company and a stock that seems unjustly discounted--its price-to-earnings ratio is only ten. For these reasons alone, Capital One is worthy of your consideration. And, of course, two proven guru strategies conclude that Capital One is worth buying.

Warren Buffett Strategy

The Buffett strategy likes companies with a competitive advantage, such as being among the largest or best known in their industry. Capital One is about to become one of the ten largest banking companies in the country, and it already has strong brand recognition; it has a Buffett-type franchise.

Another plus is that its earnings have been predictable, rising every year for the last ten years. Return on equity should be north of 15%, and Capital One's return on equity is 19.7%. Another plus is its return on assets, which needs to be at least 1%; in Capital One's case, ROA has averaged 2.5% over the past ten years.

A measure of management's ability to perform for the benefit of shareholders is how well management invested the company's retained earnings. Over the past ten years, retained earnings at Capital One have totaled $30.62, while earnings per share have jumped $5.96, which earned for shareholders a 19.5% return on the earnings kept.

This is during a period in which an index ETF such as the S&P Depositary Receipts (amex: SPY - news - people ) has struggled to produce low single-digit percentage gains on an annualized basis. Nice work, Capital One.

All of this analysis suggests that Capital One is performing well from a financial point of view. But the Buffett strategy wants the stock also to be well priced. The Buffett strategy uses two methods to analyze price, and they agree that at current prices Capital One shareholders can expect a rate of return somewhere between 13.8% and 19%, or 16.4% on average. This is very strong.

Bottom line: The company is performing well financially, and its stock is nicely priced. It's a Buffett-style buy.

Peter Lynch Strategy

The screen based on Peter Lynch's strategy also thinks Capital One is a born moneymaker. One very compelling criterion is its price-to-earnings-growth ratio, or PEG (P/E relative to growth). This should be 1.0 or less, and anything south of 0.5 is very strong. Capital One's PEG is a very strong 0.46. Note, its P/E is a weak 10.41, while its growth rate (based on the average of the three-, four- and five-year historical EPS growth rates) is 22.5%.

Also noteworthy is its equity-to-assets ratio. The Lynch strategy wants this to be at least 5%, while Capital One's is a robust 18%. Plus, its return on assets is a compelling 3% (1% is the minimum). If you loved Lynch at Fidelity Magellan (FMAGX), you could buy some Capital One to emulate the investing style of this master.

Capital One has a track record of success. It is diversifying into banking, which has its pluses. The stock is now trading at friendly levels. And the guru strategies are banking on it

John P. Reese is founder and CEO of Validea.com and Validea Capital Management. He is also co-author of The Market Gurus: Stock Investing Strategies You Can Use From Wall Street's Best . Click here for more of Reese's insights and analysis, and to learn about subscribing to the Validea Hot List. At the time of publication, John Reese and his clients owned shares of Capital One Financial.

in http://www.forbes.com/2006/08/10/capitalone-buffett-lynch-in_jr_0810guruscreen_inl.html?partner=yahootix

segunda-feira, julho 03, 2006

Martin Zweig's 3 rules for picking stocks

Martin Zweig's 3 rules for picking stocks made him a legend. A similar system might make you money, too.

By Harry Domash

Unless you've been in the stock market for some time, you've probably never heard of Martin Zweig. Whether you have or not, I'm about to explain why it's a name worth remembering.

Almost two years ago, I wrote an article with a stock-selection screen based on Zweig's strategies. The screen, run Aug. 11, 2004, turned up 17 stocks (excluding one that had already agreed to be acquired). Last week I checked on the performance of that portfolio.

Let's take a trip back in time. After its first year (as of Aug. 11, 2005), the portfolio had recorded an impressive 40% average return, compared to 15% for the S&P 500 ($INX). But the story is even better than it sounds. Often, even though recording strong average returns, such portfolios usually include a few hefty losers. But, in this case, only two stocks dropped, with the biggest loss totaling only 11%.

After the first year, the portfolio lost steam. As of June 23, it had averaged a 43% return since its August 2004 inception, vs. 16% for the S&P 500. While the average return is still impressive, the results were more volatile, with bigger winners and more weak performers.

Given those results, the Zweig screen rates another look. But first, some background on Martin Zweig.

Although no longer in the limelight, Zweig, who has a Ph.D. in finance, is well known to market professionals for his disciplined approach to the market. His now-discontinued Zweig Forecast newsletter was ranked No. 1 for risk-adjusted returns over the 15 years that it was tracked by Hulbert Financial Digest.

He has examined the relationship between stock-market action and just about every conceivable economic or market indicator. In fact, he's credited with inventing the put-call ratio market sentiment indicator.

Zweig described the results of much of his research in his best-selling book, "Martin Zweig's Winning on Wall Street," which is still in print. Much of the book covers Zweig's market-timing indicators, but he also details his stock selection strategies.

It's all in the numbers

When it comes to picking stocks, Zweig is strictly a numbers guy. As he put it, "If a company can show nice consistent earnings, I don't care if it makes broomsticks or computer parts." Zweig focuses on three main criteria to pinpoint potential winners:

- Strong historical sales and earnings growth.
- A reasonable price.
- Strong price action relative to the market.

Zweig avoids stocks that have recently disappointed the market, and he doesn't like firms carrying high debt. While he doesn't want to overpay, Zweig is willing to pay more for strong stocks. Says Zweig, "buying on strength gives you an edge. You must pay a premium, but you increase the probability of being right." I'll fill in the details as I describe my screen for finding stocks meeting Zweig's criteria. (Click here to go to MSN Money's Stock Screener.)

I'll start with sales and earnings growth, which are Zweig's top priorities.

Long-term growth

Zweig wants to see consistent sales and earnings growth, going back four or five years. He considers 15% annual earnings growth acceptable, but prefers more. In his book, he gives numerous examples of stocks with 30% to 50% historical growth rates.

I require at least 15% average annual sales and earnings-per-share growth, measured over the past five years. Try increasing the minimums for either or both to 20% or even 25%, if you get too many hits.

Screening parameter: (5-year) Annual EPS Growth Rate >= 15%

Screening parameter: 5-Year Revenue Growth >= 15%

Recent growth

Zweig avoids stocks with decelerating growth rates. He wants to see the most recent quarter's year-over-year EPS growth rate in the same ballpark as the long-term rate and, ideally, higher. However, he's not dogmatic and is willing to cut a stock a little slack, depending on conditions.

I require the most recent quarter's year-over-year EPS growth to be at least 75% of the long-term growth rate.

Screening Parameter: EPS Growth Qtr vs. Qtr >= 0.75* (5-year) Annual EPS Growth

The "depending on conditions" aspect requires a judgment call that you can't emulate in a screen. In my first Zweig article, I suggested "further checking" if the last quarter's EPS growth was near the 75% minimum.

To minimize that ambiguity, this time I'm also requiring that the most-recent quarter's year-over-year revenue growth be at least 85% of the long-term revenue growth rate. I figure that the problem is temporary if earnings stumble but revenue growth remains reasonably on track.

Screening Parameter: Revenue Growth Qtr vs. Qtr >= 0.85* (5-year) Annual Revenue Growth.
Revenues keep pace

Ideally, earnings growth should track revenue growth. Revenues growing faster than earnings reflect declining profit margins, which signals that market conditions are becoming more competitive. Conversely, earnings growing faster than revenues says that the growth is coming from cost cutting rather than growing sales. If that's the case, eventually, the company will run out of places to cut costs, and earnings growth will slow.

So, while they won't track precisely, Zweig wants to see stocks with revenue and EPS long-term growth rates in the same ballpark. To emulate that condition, I require that long-term revenue must be at least 75% of earnings, and vice-versa.

Screening Parameter: (5-year) Annual EPS Growth Rate >= 0. 75*5-Year Revenue Growth

Screening Parameter: 5-Year Revenue Growth .+ 0.75*(5-year) Annual EPS Growth Rate

Don't overpay

Zweig doesn't want to overpay for stocks. He uses price-to-earnings ratios to measure valuation, but he doesn't set a hard-and-fast limit. Instead, his definition of overvalued depends on the market. In the examples in his book, Zweig accepts fast-growing companies with P/Es as much as 50% higher than the overall market.

I use the S&P 500 average P/E to represent the market, and reject stocks trading with P/Es more than 50% above the S&P.

Screening Parameter: P/E Ratio: Current <= 1.5*S&P 500 Average P/E Ratio: Current Don't underpay

As much as he doesn't want to overpay, Zweig also avoids stocks that are too cheap. For him, very low P/Es signal that investors are abandoning ship, probably for good reason.

In his book, Zweig advised shunning stocks with P/Es below 5. Since his maximum P/E varies with the market, I used the same approach for defining "too cheap." When he wrote the book, a P/E of 5 equated to roughly 40% of the market average, so I set my minimum P/E at that level.
Screening Parameter: P/E Ratio: Current >= 0.4*S&P 500 Average P/E Ratio Current

Pick winners

Zweig said he prefers stocks that are outperforming the market, although he will accept stocks "acting at least as well as the market."

Relative strength measures a stock's performance compared with the overall market over a specified timeframe. Zweig didn't mention a timeframe, but from his descriptions, I guessed that six months was in the ballpark. A 50 relative strength indicates a stock performing even with the market. Try increasing the minimum to 55 or 60 if you get too many hits.

Screening Parameter: 6-month Relative Strength>=50

Bad debt

Zweig said he prefers to avoid high-debt firms, but he wasn't specific. The debt-equity ratio, which is long-term debt divided by shareholders' equity, is the most-commonly used debt measure. Zero values signal no long-term debt, and the higher the ratio, the higher the debt.
Since Zweig was vague in his definition of high debt, and acceptable debt levels vary by industry, I rule out companies with debt-equity ratios higher than their industry average.

Screening Parameter: Debt to Equity Ratio <= Industry Average Debt to Equity Ratio Don't be surprised

Zweig avoided stocks that had recently disappointed the market by reporting earnings below forecasts. So, I rule out stocks with recent negative earnings surprises.

Screening parameter: Recent Qtr Surprise %>=0

Zweig also said he prefers stocks with some insider buying, or, at least minimal insider selling. In my original screen, I disqualified stocks where insider selling exceeded insider buying. However, I found that option exercises and related selling distorted the insider data. So, this time, I'm eliminating that requirement.

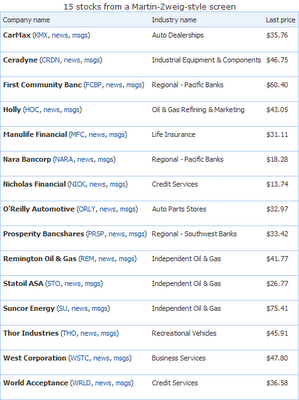
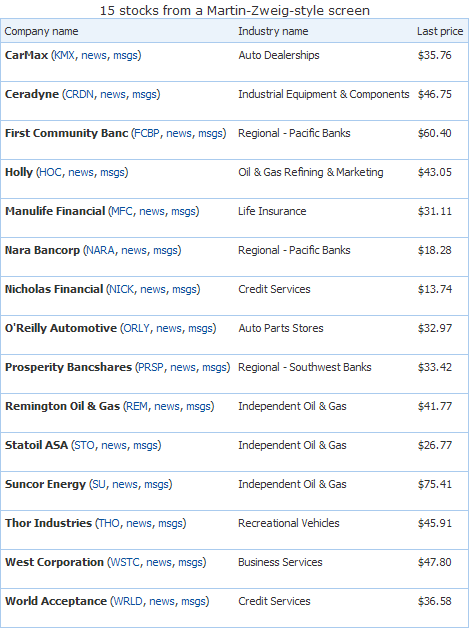
My screen turned up 15 stocks, with four of them in the energy sector. There was also an overweighting of regional banks, with two stocks in that category. Risk-averse investors should avoid duplicating stocks in the same industries. One of the stocks, Nicholas Financial (NICK, news, msgs), was in my original screen from August 2004.


Zweig advises selling a stock if it drops roughly 15% below the purchase price. Otherwise, plan on holding these stocks for one year and then selling.

in http://articles.moneycentral.msn.com/Investing/SimpleStrategies/
MasterStrategistsSystemPicks15Gems.aspx?page=2

terça-feira, junho 20, 2006

Análise Bed Bath & Beyond

Poucas empresas detêm um track record de crescimento de resultados e rentabilidades tão consistentes: Média crescimento de resultados = 30%/anos nos últimos 10 anos com uma média de retornos no capital próprio de 26.81%.

O negócio é a venda a retalho de mobília, merchandise doméstico, produtos de beleza e saúde, etc... A empresa é superiormente gerida e bastante competitiva, geradora de fortes cash-flows. A dívida de longo prazo é zero. O potencial de abertura de lojas é grande e a expansão para outros conceitos de loja também. As estimativas de resultados apontam para um crescimento nos próximos 5 anos na ordem dos 15%. O retorno ao accionista através de programas de recompra de acções é também bastante apetecível, para além do sinal de confiança que a administração transmite ao mercado. Um abrandamento no mercado imobiliário pode eventualmente abrandar o crescimento das vendas.

Já sigo esta empresa à dois anos. Mas só entraria neste negócio de eleição ao preço certo. Julgo a zona de entrada que transmitiria uma margem de segurança suficiente será abaixo dos 35$.

A acção encontração com múltiplos em mínimos históricos e a cotação em cima do suporte dos 35$.

Ficam alguns dados descritivos do negócio bem como um gráfico com a correspondente análise técnica.


sexta-feira, junho 16, 2006

Good to Great: Why Some Companies Make the Leap... and Others Don't

Um excelente livro sobre as qualidades intrínsecas que os grandes negócios possuem que os conduzem à excelência. A qualidade da administração, o foco no seu core business, a comunicação com o mercado ou as relações entre colaboradores, são alguns factores que Jim Collins encontrou para justificar o desempenho espectacular de 11 empresas que deram o salto.

Este é um trabalho pertinente para quem procura avaliar as qualidades subjectivas de um determinado negócio para além dos números dos relatórios financeiros na linha do que Phil Fisher fazia e como bem explicou em Common Stocks and Uncommon Profits and Other Writings.


Amazon.com's Best of 2001Five years ago, Jim Collins asked the question, "Can a good company become a great company and if so, how?" In Good to Great Collins, the author of Built to Last, concludes that it is possible, but finds there are no silver bullets. Collins and his team of researchers began their quest by sorting through a list of 1,435 companies, looking for those that made substantial improvements in their performance over time. They finally settled on 11--including Fannie Mae, Gillette, Walgreens, and Wells Fargo--and discovered common traits that challenged many of the conventional notions of corporate success. Making the transition from good to great doesn't require a high-profile CEO, the latest technology, innovative change management, or even a fine-tuned business strategy. At the heart of those rare and truly great companies was a corporate culture that rigorously found and promoted disciplined people to think and act in a disciplined manner. Peppered with dozens of stories and examples from the great and not so great, the book offers a well-reasoned road map to excellence that any organization would do well to consider. Like Built to Last, Good to Great is one of those books that managers and CEOs will be reading and rereading for years to come.

Harry C. Edwards

http://www.amazon.com/gp/product/0066620996/sr=8-1/qid=1150478367/ref=pd_bbs_1/104-7298190-0727155?%5Fencoding=UTF8

quarta-feira, abril 12, 2006

The Little Book That Beats the Market

Editorial Reviews

From Publishers WeeklyContrary to efficient-market naysayers, this engaging investment primer contends that ordinary stock-market investors can indeed get better-than-market returns over the long haul. Greenblatt (You Can Be a Stock Market Genius), a Columbia Business School adjunct professor, touts a "value-oriented" approach that looks for bargain stocks whose share price is cheap relative to the company's profitability. His version is a "magic formula" that ranks stocks on the basis of two variables—the earnings yield and the business's return on capital. His Web site, magicformulainvesting.com, virtually automates the procedure for novices. Greenblatt offers lots of statistical proof of the formula's success, but emphasizes the importance of faith in seeing the investor through inevitable short-term downturns: "It will be your belief in the overwhelming logic of the magic formula that will make the formula work for you in the long run." He conveys his ideas through a lucid if rudimentary and rather corny explanation of basic investment concepts about risk, return, interest and business valuation. Although the fabulous returns he touts seem too good to be true, Greenblatt's formula is a reasonable variant of mainstream value-investing methods. Investors seeking a little more hands-on excitement than the average mutual fund offers won't go too far wrong following his advice. (Jan.) Copyright © Reed Business Information, a division of Reed Elsevier Inc. All rights reserved. Review“a marvellously clear explanation of the value investing approach” (Financial Times (also on FinancialNetnews.com) 10th December 2005)

“The book is certainly written simply and the concepts are conveyed compelling” (Daily Telegraph, 29th November 2005)

"The Little Book is one of the best, clearest guides to value investing out there." (The Wall Street Journal, November 9, 2005)

sexta-feira, março 24, 2006

Investment Rules of Warren Buffet

WARREN BUFFETT


Buffett is known as the worlds greatest ever investor and here are some of the rules that he follows:


Commonsense Investment Rules

1. Have a written or mental note of your investment plan and have the discipline to follow it.
Be flexible enough to change or evolve your investment strategies when sound judgement and conditions so warrant.

2. Study sales and earnings of a company and how they are derived.

3. Focus on your purchase candidate. Understand the firm’s products or services, the company’s position in its industry, and how it compares with the competition.

4. Learn as much as possible about the people managing the business.

5. When you find a great stock value, don’t be swayed by predictions for the stock market or the economy.

6. Sit on the sidelines in a cash position if you can’t find investments of value based on your criteria. Many emotional investors make the mistake of buying at very high prices relative to value.

7. Define what you don’t know as well as what you do know and stick to what you know.


Evaluation Rules

1. Is the business understandable?

2. Are the CEO and top executives focused and capable based on the firm’s previous track record of sales and earnings and how the business is run?

3. Does management report candidly to shareholders?

4. Does the company have top quality, brand name products used repeatedly and high customer loyalty?

5. Does the company have a wide competitive edge and barriers to potential competition?

6. Is the business generating good owner earnings; free cash flows?

7. Does the business have a long-term history of increasing sales and earnings at a favourable rate of growth?

8. Has the company achieved a 15 percent or better return on shareholders equity and a return that compares favourably with alternative investments?

9. Has the company maintained a favourable profit margin compared with the competitors profit margin?

10. What are the goals of the business and the plans to achieve them?

11. What are the risks of the business?

12. Does the business have good financial strength with low or manageable debt requirements?

13. Is the stock selling at a reasonable price relative to future earnings and price potential?


GLOSSARY


Net Profit Margin = Net Income
Sales


Operating Profit Margin= Operating Earnings before Interest, Depreciation and Taxes
Sales


Book Value Per Share= Assets- Liabilities
Number of Shares Outstanding


Return on Shareholders’ equity = Net Income
Common stock equity


Debt to capital ratio = Long-Term Debt
Long-Term debt + Shareholders Equity

quinta-feira, março 16, 2006

Picking Stocks: Value and Growth Metrics

by Alan Hartley 03-15-06 06:00 AM

Most great investors don't concern themselves with value versus growth, but instead focus on finding good stocks at good prices. After all, even a wonderful business isn't a good investment if the price is too high. To quote Warren Buffett on the matter, "growth and value investing are joined at the hip." If one of the greatest investors of all time doesn't pigeonhole himself, why should you? The quest for good "value" can often lead to a growth stock that many value devotees have overlooked, so use all the tools at your disposal.

At Morningstar, we pride ourselves on using our discounted cash-flow model to estimate a company's intrinsic worth. At its most simplistic, we forecast a company's financial statements for at least the next five years and discount the future cash flows back at the company's cost of capital. If the stock is trading significantly below our fair value estimate, what we call the margin of safety, we consider investing. This long-term approach captures both value and growth and gives Morningstar a powerful advantage of time horizon arbitrage over our competitors and other techniques that focus only on the next several quarters.

That said, multiple analysis, which captures only one year of data, is still valuable if used properly. The most popular and perhaps the most useful is the trailing price/earnings, or P/E, ratio (the price of the stock divided by the most recent 12 months' earnings per share). When a company that has averaged a 31 P/E over the last five years but today trades at a P/E of only 18 (think Wal-Mart WMT), it may represent a good buying opportunity. But historical earnings are not always representative of the future, of course. The next year could present an entirely different situation and may explain the drop in P/E.

A ratio widely used by growth enthusiasts is the PEG ratio (a company's P/E ratio divided by its estimated future earnings per share growth rate). A benefit that the PEG ratio has over P/Es is that it accounts for both the past and the future. But because the PEG ratio uses the company's P/E ratio, it has the same limitation with a caveat: The five-year EPS growth rate used in the calculation is only an estimate, and results could be materially different than expected. A simple rule of thumb is if a company trades for one-and-a-half times its growth rate (a PEG ratio of 1.5) or less, it may be worth a look.

Investors often swear by a particular method, but why not combine them and look for stocks that are cheap by each measure? Here are five 5-star stocks that pass each test and have compelling fundamentals:

3M MMM
Analyst: Scott BurnsFair
Value Estimate: $89
Consider Buying Price: $75.80
From the Analyst Report: 3M's history of innovation often overshadows the company's ability to generate strong profits on mundane products. Although many of 3M's products are high-margin branded or patented products, the company has made things such as sandpaper, adhesives, Post-it notes, and Scotch tape for decades. 3M fiercely protects its patents and uses its protected period to perfect its production processes. Combining this production expertise with the company's global manufacturing base makes it cost prohibitive for rivals to undercut its prices once items fall off patent. As a result of its patents, brands, and low-cost production, 3M has averaged 18% operating margins over the past five years.

Apollo Group A APOL
Analyst: Kristan Rowland
Fair Value Estimate: $70
Consider Buying Price: $54.00
From the Analyst Report: Apollo's regional accreditation, recognizable brands, and solid reputation contribute to its wide moat. Its University of Phoenix and Western International University are regionally accredited. Accreditation is difficult to obtain and allows UOP and WIU to participate in federal student aid programs (63% and 72% of students at each institution, respectively).

Applebee's International APPB
Analyst: John Owens, CFA, CPA
Fair Value Estimate: $33
Consider Buying Price: $25.40
From the Analyst Report: With a potential universe of 3,000 domestic restaurants, Applebee's still has substantial opportunity for growth, in our opinion. The management team has proved very adept at development, opening at least 100 new restaurants for 13 consecutive years. The company has been particularly successful in seizing a first-mover advantage in small-town locations with a unit design that generates healthy returns. Over the past five reported years, the firm delivered a 23% average return on invested capital, well above our estimate of its cost of capital.

Johnson & Johnson JNJ
Analyst: Tom D'Amore, CFA
Fair Value Estimate: $76
Consider Buying Price: $64.80
From the Analyst Report: J&J is a model of consistency and stability. The firm has delivered 19 consecutive years of double-digit earnings increases and 42 consecutive years of dividend increases. Cash flow from operations covers the dividend nearly 3 times. J&J has an excellent record of capital allocation and generation. Returns on invested capital averaged 22% during the past five years.

Maxim Integrated Products Inc. MXIM
Analyst: Larry Cao, CFA
Fair Value Estimate: $52
Consider Buying Price: $40.10
From the Analyst Report: Maxim's focus on profitable growth has achieved remarkable financial success. With high margins and stable returns on invested capital, Maxim's financials can easily be mistaken for those of a top-tier software company. In its fiscal 2005, Maxim achieved gross margin of 72%, operating margin of 47% (both before deducting stock option expenses), and return on assets close to 20%. Not only does its profitability outshine chip industry peers, it also rivals that of software giants Microsoft and Oracle.

in http://news.morningstar.com/article/article.asp?id=157493&pgid=wwhome1a

quinta-feira, janeiro 26, 2006

Buy Quality on the Cheap

By Shannon Zimmerman (TMF Zman) January 25, 2006

A quick check of the market's sale rack finds the following:

ExxonMobil (NYSE: XOM), Microsoft (Nasdaq: MSFT), Citigroup (NYSE: C), and Wal-Mart (NYSE: WMT) are all trading with trailing-12-month price-to-earnings (P/E) ratios that clock in below their respective industries' and their own five-year averages. Pfizer (NYSE: PFE), Johnson & Johnson (NYSE: JNJ), and Intel (Nasdaq: INTC) are trading at significantly discounted levels, too.

Which can only mean one thing, right? It's time to ...

Buy low! Sell high!
Just joshing. Indeed, that's one piece of investment "advice" that I suspect you've heard all too many times, and the only proper response to it is, "Well, duh." The real question, of course, is how to know if you're buying low and selling high, and one compelling way to answer that question is with discounted cash flow (DCF) analysis.

Show you the moneyRather than focusing myopically on earnings (which are easily fudged) or some kind of short-term market catalyst (which may never materialize), DCF analysis requires companies to show you the money -- literally.

By zeroing in on a firm's free cash flow (cash from operations less capital expenditures), making conservative assumptions about future earnings growth, and applying a discount rate (i.e., the return you require given a firm's business risk), you'll be in a good position to determine if a company is trading above or below its intrinsic value -- and within your margin of investing safety.

Follow the FoolThat's the tack that Philip Durell -- the Fool who leads the charge at our Motley Fool Inside Value newsletter -- takes each month as he scoops up two picks from the market's bargain bin for his subscribers. These are companies with loads of free cash flow (FCF) but whose stock is currently on sale.

One of Philip's picks, for example, is a beverage-industry behemoth that has delivered well over a billion dollars in FCF in each fiscal year since 1998 and currently trades at a P/E ratio below both its industry and that of the broader market. Another is a tech-industry titan whose current P/E is little more than half its five-year average -- despite the fact that it generated more than $4.7 billion of FCF in fiscal 2005!

Now what?The next time you think you've found a quality company at a can't-miss price, make sure it shows you the money. Using DCF analysis can help guide you to real cash and real promise -- for a real bargain.

And if you'd like to sneak a peek at Philip's full lineup of picks, just click here to take Inside Value for a risk-free spin. Your trial won't cost a thing for 30 days and will come in mighty handy, I suspect, as you go about the very important business of generating a little free cash flow of your own.

Shannon Zimmerman is the lead analyst for the Motley Fool Champion Funds newsletter service and doesn't own shares of any of the companies mentioned. Pfizer and Microsoft are Inside Value recommendations. The Fool has a strict disclosure policy.

segunda-feira, janeiro 16, 2006

Análise Timberland


Uma das apostas mais fortes da carteira. Vejamos porquê.

Timberland é uma marca reconhecida em termos mundiais pela qualidades dos seus produtos (calçado e roupa) e lojas que se traduzem em margens de lucro médias superiores aos seus concorrentes directos.

Rentabilidade média nos últimos 10 anos do capital próprio na ordem dos 23%, crescimento de resultados anualizados superior a 27% e rácios de solvabilidade muito conservadores (dívida praticamente inexistente).

Comecei a entrar neste título em Maio do ano passado quando o título começava a entrar em máximos e com um sinal técnico bastante interessante. Teve uma apreciação assinalável que aproveitei para a realização de algumas (poucas) mais-valias. No entanto, em finais de Julho, na apresentação de resultados, os números anunciados desiludiram os investidores (com a valoriação do dólar as receitas oversees caíram) e as acções recuaram bastante. Aproveitei este recuo para reforçar de forma mais significativa a posição.

Julgo que assumi demasiado cedo uma posição muito pesada no título e aquando da divulgação de resultados no trimestre seguinte, que pela segunda vez consecutiva saíram abaixo das expectativas dos analistas, a acção voltou a recuar bastante e não pude entrar a esses preços mínimos visto já ter uma posição significativa no título.

A posição mantém e o título tem recuperado bem em direcção ao seu real valor intrínseco. A próxima apresentação de resultados está estimada para o dia 9 de Fevereiro.

Tenho por objectivo reduzir o peso deste título na carteira uma vez que acho ser demasiado para um negócio de resultados algo sazonais.

Ficam os dados fundamentais bem como o gráfico do título.